Elsevier in 2018: decrease in number of fully OA journals

Highlights: in 2017, we found that Elsevier was publishing a large number of fully open access journals with no article processing charges due to society or university sponsorships. In 2018, 88 of these titles have been transferred back to the society or university. There has been a drop in the number of fully OA journals published by Elsevier, from 416 to 328 journals. The majority of Elsevier’s fully OA journals are still non-charging. The average APC for Elsevier fully OA journals in 2018 is $1,470 USD, up 6% from 2017.

Raw data – 2 excel spreadsheets (caution – this is preliminary data that is designed for quantitative analysis and does not have detailed documentation). Click to download.

Elsevier_OA_main_2018_final_v1

This is a subset of the 2018 version of the main spreadsheet for the open access article processing charges project. The columns for the 2018 – 2017 comparison on the main Data tab are D, 2018 APC publisher website original currency, and N for 2017. Pricing is from the Elsevier APC price list; “no publication charge” is our standardized term, on the Elsevier PDF this is “Fee waived for author”. If you are interested in the journals that have transferred back to a society or university, go to the next spreadsheet:

Elsevier-noapc_2017_02_16_main_Updated_2018_10_27

In 2017 we noted that there are many Elsevier journals that are “fee waived for author” due to sponsorships and decided to begin tracking these sponsorships and an interesting model of partnership, e.g. statements on the Elsevier webpage that made it clear that Elsevier was publishing on behalf of a society or university that retained copyright. Column I, the notes field for 2018, is where you will find details on journals transferred back to the publisher. This information is gathered from the Elsevier website – journal title list, not the APC price list.

E2018numberjournals

Details

 In April 2017, Elsevier was publishing 416 fully open access journals. As of April 2018, this number had decreased to 328 journals, a decrease of 88 journals or 20% of the total. Data is from the Elsevier APC price list (conversion necessary for data manipulation).E2018nonchargingjpg

Most fully OA journals published by Elsevier do not charge publication fees (61% of the total) due to sponsorship by societies or universities. This percentage is about the same as the previous year (57% non-charging). A survey conducted in 2017 found that almost all non-charging journals were published by Elsevier on behalf of a society or university, with copyright ownership retained by the society or university.

A survey of the Elsevier website for OA journals identified as non-charging in 2017 was conducted over the summer. These journals are still listed on the Elsevier website if not the APC price list and information is provided about the current status of the journals. This is a good practice. A total of 88 journals were found to have been transferred back to the society in 2017 or 2018, or scheduled to be returned to the society or university publisher.

For example, a notes about the The Revista Mexicana de Bioversidad indicated that the journal:

Transferred back to the society as of 2018
Copyright © 2018 Universidad Nacional Autónoma de México.


The average APC for Elsevier’s charging, fully OA journals in 2018 was $1,470 USD, up from $1,384 USD in 2017, an increase of 6%.

Thanks to René Duplain for data gathering.

Cite as:

Morrison, H. (2018). Elsevier in 2018: Decrease in number of fully OA journals. Sustaining the Knowledge Commons / Soutenir Les Savoirs Communs. Retrieved from https://sustainingknowledgecommons.org/2018/12/13/elsevier-in-2018-decrease-in-number-of-fully-oa-journals/


AOSIS: a South African OA publisher with an interesting approach

African Online Information Systems (PTY) Ltd. (AOSIS) is a South African private company (PTY) registered under the number 2002/002017/07. AOSIS is an Open Access publisher with a portfolio of 39 journals as of July 21st, 2018. The journals can be divided under three categories: Fully Sponsored, Partially Sponsored and Non-Sponsored. The partially sponsored journals are interesting for several reasons: 1) unique transparency in explaining that the journals are “sponsored until the money runs out”, a model that creates some uncertainty for authors as to whether they need to pay or not, and how much; 2) differential pricing for members of society sponsors (support for the society as well as OA publishing); 3) and the use of per-page rather than per-article charges. These complexities result in differential pricing for articles for good underlying reasons (sponsorship and its limitations, societies’ needs to provide benefits to members, the variation in work that goes with differences in article length).

AOSIS is using Article Processing Charges by Page (APPC) method for publication in its journals. The APPC varies from a journal to another. Partially sponsored journals receive limited funds from organizations to cover partially the APPC during a calendar year. Authors publishing in partially sponsored journals are responsible for payment of the difference between the APPC full amount and the sponsor’s contribution per page. If the funds allocated by the sponsor for APPC are used before the end of calendar year, authors would have to cover the full APPC. In the case of the Journal of Transport and Supply Chain Management, APPC is listed as R1002.00/page (R = South African Rand, currency code: ZAR) equivalent to USD 76.00/page (Exchange rate Aug. 1, 18 at https://www.xe.com/) while the sponsor contribution is R398.00/page ($30.00) which leaves the author with the responsibility to cover the payment of the difference (R604/page) ($46.00).

The South African Journal of Communication Disorders applies, however, different APPC method: the first author receives full subsidies for APPC if he is a paid member in the South African Speech-Language-Hearing Association (SASLAH), while the second author receive 50% subsidies of APPC. If the author is not a member of SASLHA he would have to pay the full APPC. The subsidy for APCs is valid until the limit of the annual SASLHA sponsorship has been reached. Author wishing to publish after the funds are completely used would have the cover the full APPC.

References

AOSIS (2018). Retrieved July 21st, 2018 from https://aosis.co.za/publishing/

Cite as: Merhi, S. (2018). AOSIS: A South African OA publisher with an interesting approach. Sustaining the Knowledge Commons / Soutenir Les Savoirs Communs. Retrieved from https://sustainingknowledgecommons.org/2018/07/28/aosis-a-south-african-oa-publisher-with-an-interesting-approach/


ELPUB 2018: Global OA APC trends 2010 – 2017

The final paper is now available in the HAL archive at: https://elpub.episciences.org/4604

This June 22 – 24 I will be attending and presenting at ELPUB 2018 on Global Open Access APCs 2010 – 2017: major trends. The slides for my talk on Saturday, June 23 are available here: https://www.slideshare.net/hgmorris/hgm-elpub2018

Abstract

The open access (OA) article processing charges (APC) project is a longitudinal study of the minority of fully OA journals (27% in 2016) that have APCs. The global average APC shows little change; in USD, 906 in 2010, 964 in 2016, 974 in 2017. The average masks currency differences and the impact of a growing market; new APC journals often start with an APC of 0. Traditional commercial scholarly publishers are entering the OA market: the largest OA journal publishers’ portfolios in 2017 were Springer, De Gruyter, Elsevier, and Wolters Kluwer Medknow. However, these are a small portion of OA journal publishing which is still marked by a very long tail and extensive involvement by very small, often university or society publishers. APC pricing shows a wide range and variability. The APC market can be described as volatile.

Keywords: OA, APCs, economics

Citation – please cite (and ideally, read) the original:

Morrison, H. (2018). Global OA APCs (APC) 2010–2017: Major Trends (L. Chan & P. Mounier, Trans.). ELPUB 2018. Presented at the Toronto, Canada. Retrieved from https://hal.archives-ouvertes.fr/hal-01816699


Recent APC price changes for 4 publishers (BMC, Hindawi, PLOS, PeerJ)

Following is a summary of recent APC changes for 4 publishers, prepared on request but posted in case this might be of interest to anyone else. In brief, each publisher appears to be following a different pricing strategy ranging from flat pricing over many years with one rare exception, to a tenfold increase from 2016 – 2017.

BioMedCentral: mixed picture

• 269 journals with numeric data 2017 and 2018 (April 4 sampling date both years)
• 20 with price increases of 2% – 83% (30 – 620 GBP)
• 5 with price decreases of 1% – 15% (15 – 205 GBP)
• Of interest: 25 journals with no publication fee (appears to be society / university sponsorship)
• Of concern: 44 journals with “title not found”: some will reflect earlier title drop

Hindawi April 2016 – November 2017: mixed picture, price increases a bit concerning

• 281 journals with numeric data for 2016 and 2017 (including 0 = free for now*)
• 99 journals have price increases ranging from 14 – 108% (100% = price has doubled), increases of 250 – 650 USD
• 115 journals have no change in pricing
• 45 journals have price decreases of 6 – 25%, 50 – 100 USD
• Of interest: 230 Predecessor journals (ISRN series): good practice
• Of concern: 186 title not found (not limited to 2017), excluding predecessor

*Rotating free journals: 5 of the 281 journals were free in 2016; 1 is still free, the other 4 have APCs of 1250 – 1750 USD. 17 journals that had an APC in 2016 were free in 2017. Paul Peters sent an e-mail explaining this strategy a few years ago.

PLOS ONE: flat pricing with one exception
From 2014 – 2018, there has been only one price change for PLOS journals: PLOS ONE was $1,350 USD in 2014 and is $1,495 USD today. The sample date was December 2017, a visual scan confirms the same prices are in effect as of April 13, 2018.

PeerJ: tenfold price increase from 2016 – 2017 (99 USD – 1,095 USD); new journal PeerJ Computer Science is 895 USD.

See also yesterday’s post Frontiers: 40% of journals have price increases from 18 – 31%.

Cite as:

Morrison, H. (2018). Recent APC price changes for 4 publishers (BMC, Hindawi, PLOS, PeerJ). Sustaining the Knowledge Commons / Soutenir Les Savoirs Communs. Retrieved from https://sustainingknowledgecommons.org/2018/04/13/recent-apc-price-changes-for-4-publishers-bmc-hindawi-plos-peerj/


Frontiers: 40% journals have APC increases of 18 – 31% from 2017 to 2018

Of the 56 active titles listed on the Frontiers website as of April 11, 2018, 22 or close to 40% have increased pricing for type A articles by 18 – 31% from a year earlier. These high percentage increases come on top of already high prices. For example, Frontiers in Psychology has increased from $2,490 USD to $2,950 USD, an increase of $460 USD or 18%, while Frontiers in Pediatrics has increased from $1,900 USD to $2,490 USD, an increase of $590 or 31%. One journal, Frontiers in Digital Humanities, has decreased in price, the others have not changed and there is one new title. The following table shows titles, APC pricing copied from the Frontiers website April 11, 2017 and April 11, 2018, and the change in pricing in $ and percentage. Frontiers in Sustainable Food Systems is new.

Title 2018 APC Type A article Frontiers website in USD 2017 APC Type A article Frontiers website in USD 2018 – 2017 2018 – 2017 percentage change
Frontiers in Endocrinology 2,490 1,900 590 31%
Frontiers in Genetics 2,490 1,900 590 31%
Frontiers in Neurology 2,490 1,900 590 31%
Frontiers in Pediatrics 2,490 1,900 590 31%
Frontiers in Psychiatry 2,490 1,900 590 31%
Frontiers in Aging Neuroscience 2,950 2,490 460 18%
Frontiers in Behavioral Neuroscience 2,950 2,490 460 18%
Frontiers in Cellular and Infection Microbiology 2,950 2,490 460 18%
Frontiers in Cellular Neuroscience 2,950 2,490 460 18%
Frontiers in Computational Neuroscience 2,950 2,490 460 18%
Frontiers in Human Neuroscience 2,950 2,490 460 18%
Frontiers in Immunology 2,950 2,490 460 18%
Frontiers in Microbiology 2,950 2,490 460 18%
Frontiers in Molecular Neuroscience 2,950 2,490 460 18%
Frontiers in Neural Circuits 2,950 2,490 460 18%
Frontiers in Neuroanatomy 2,950 2,490 460 18%
Frontiers in Neuroinformatics 2,950 2,490 460 18%
Frontiers in Neurorobotics 2,950 2,490 460 18%
Frontiers in Neuroscience 2,950 2,490 460 18%
Frontiers in Pharmacology 2,950 2,490 460 18%
Frontiers in Physiology 2,950 2,490 460 18%
Frontiers in Plant Science 2,950 2,490 460 18%
Frontiers in Psychology 2,950 2,490 460 18%
Frontiers in Digital Humanities 950 1,150 -200 -17%
Frontiers in Communication 950 950 0
Frontiers in Education 950 950 0
Frontiers in Research Metrics and Analytics 950 950 0
Frontiers in Sociology 950 950 0
Frontiers in Applied Mathematics and Statistics 1,150 1,150 0
Frontiers in Astronomy and Space Sciences 1,150 1,150 0
Frontiers in Built Environment 1,150 1,150 0
Frontiers in ICT 1,150 1,150 0
Frontiers in Mechanical Engineering 1,150 1,150 0
Frontiers in Nutrition 1,150 1,150 0
Frontiers in Robotics and AI 1,150 1,150 0
Frontiers in Bioengineering and Biotechnology 1,900 1,900 0
Frontiers in Cardiovascular Medicine 1,900 1,900 0
Frontiers in Cell and Developmental Biology 1,900 1,900 0
Frontiers in Chemistry 1,900 1,900 0
Frontiers in Earth Science 1,900 1,900 0
Frontiers in Ecology and Evolution 1,900 1,900 0
Frontiers in Energy Research 1,900 1,900 0
Frontiers in Environmental Science 1,900 1,900 0
Frontiers in Integrative Neuroscience 1,900 1,900 0
Frontiers in Marine Science 1,900 1,900 0
Frontiers in Materials 1,900 1,900 0
Frontiers in Medicine 1,900 1,900 0
Frontiers in Molecular Biosciences 1,900 1,900 0
Frontiers in Oncology 1,900 1,900 0
Frontiers in Physics 1,900 1,900 0
Frontiers in Public Health 1,900 1,900 0
Frontiers in Surgery 1,900 1,900 0
Frontiers in Synaptic Neuroscience 1,900 1,900 0
Frontiers in Veterinary Science 1,900 1,900 0
Frontiers in Systems Neuroscience 2,490 2,490 0
Frontiers in Sustainable Food Systems 950

Cite as: Morrison, H. (2018). Frontiers: 40% journals have APC increases of 18 – 31% from 2017 to 2018. Sustaining the Knowledge Commons / Soutenir Les Savoirs Communs. Retrieved from https://sustainingknowledgecommons.org/2018/04/12/frontiers-40-journals-have-apc-increases-of-18-31-from-2017-to-2018/


DOAJ APC information as of Jan 31, 2018

DOAJ 2018 APCs: an overview

by Heather Morrison

Abstract

The purposes of this small study are to determine the extent to which the longitudinal open access article processing charges (OA APC) project can rely on DOAJ APC data rather than individual journal lookup, to capture some highlights of DOAJ APC data as of January 31, 2018, and compare these with our 2014 survey of DOAJ journals charging APCs. Selected findings: 71% of the 11,001 journals listed in DOAJ do not charge APCs [emphasis added to avoid adding to conflation of OA with APC]. For most journals, a URL as to where this information can be found is provided, indicating that DOAJ staff have verified that there are no publication charges. 28% do charge APCs, and the remainder have no information on APCs. The average price converted to USD is nearly identical in 2014 and 2018, however the reader is advised to read the details and limitations, as this must be interpreted with caution. Of the 3,131 journals with APCs, 37 different currencies are listed. A few currencies dominate, particularly USD at nearly half of the journals. A breakdown of average prices and range of prices by currency are presented. The most remarkable finding is the range; on average the highest APC for a given currency is close to 4,000 times higher than the lowest APC. This tends to support our 2014 conclusion of a volatile APC market. In conclusion, DOAJ metadata is very useful for the OA APC study, and in particular can be considered a reliable source for journals with no publication charges.

Method

On January 31, 2018 the DOAJ metadata set was downloaded from https://doaj.org/faq#metadata, saved in .csv format, opened in Open Office in Unicode to retain non-English characters, and saved as .ods and .xls. The excel file is used for data processing, and the other formats are retained as backups. APC amounts were converted to USD using the XE currency converter web service * as of January 31, 2018, the date of data collection.

Results

As of January 31, 2018, the DOAJ metadata file included 11,001 journals. DOAJ now includes some ceased journals, for example the Hindawi ISRN series which has been collapsed into a single journal, a good practice because content in these journals is still valuable and should not be removed from the primary journal directory in the area of open access. However, there is no indication in the metadata regarding ceased journals; although the vast majority are still active, the actual number of active journals listed in DOAJ does not appear to be possible to discern.

Of the 11,001 journals, the response to the question: “Does the journal have article processing charges?” (Journal article processing charges is the column name in the metadata spreadsheet) is:

Number of journals % of total (rounded)
No 7,766 71%
Yes 3,131 28%
No information 104 1%
Total 11,001 100%

Of the 7, 766 journals indicating “no” to the APC question, 7,438 have a URL listed in the column “APC information URL”. According to DOAJ Operations Manager Dominic Mitchell (2018), when a URL is listed in this column, it means that DOAJ staff have verified the information. This means that when DOAJ metadata says “no” to the APC question and an “APC information URL” is listed, one can be quite confident that the journal does not have an APC, at least not at the time of checking. That’s 68% of the total journals listed in DOAJ that have been vetted and found not to have publication charges. For the purposes of the longitudinal study, these journals will be identified as “no publication charge” for 2018. A random sampling of these journals might be advisable in the future to view whether APC charging status has changed.

In response to the question, “Does the journal have article submission charges?” there were 212 “yes” responses, a bit less than 2% of the journals listed in DOAJ. All journals with submission charges also have APCs listed. Submission charge data are noted for the purpose of completeness; they are not considered in the following results and discussion, as there is no indication in DOAJ as to whether submission charges are deducted from the APC if an article is accepted for publication.

Currency

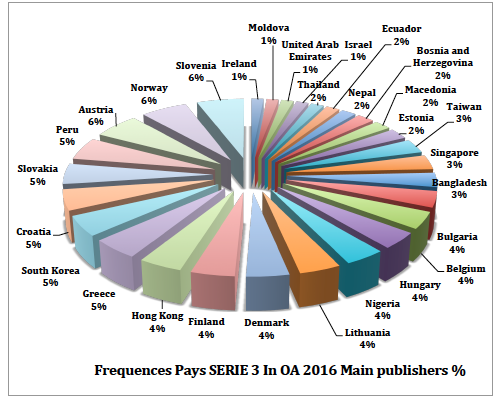
Of the 3,131 journals listed as having an APC, a total of 37 currencies are listed. USD accounts for nearly half of the total. USD, GBP, and EUR together account for about 80% of the total. Chart 1 below illustrates the frequency of currencies representing over 1% of the total APC-charging journals.

Chart 1: APC charging journals in DOAJ January 2018 by currency
Table 1 below lists APC averages, range, and range ratio by currency. The range ratio is included to illustrate the wide spread of APCs within currencies. No range is provided by currencies with just one journal. The average range ratio is 3,781; in other words, on average the highest APC for a given currency is close to 4,000 times higher than the lowest APC. The range in USD is $1 – $5,000. In EUR, it’s 10 – 3,300.

DOAJ APC-charging journals as of January 31, 2018
APC average, range and range ratio by currency
Currency # journals APC average Range – low Range – high Range ratio high / low
ARS – Argentine Peso 6 2,504 26 5,000 192
AUD – Australian Dollar 6 460 120 2,000 17
BRL – Brazilian Real 57 540 12 3,000 250
CAD – Canadian Dollar 3 327 30 750 25
CHF – Swiss Franc 116 710 156 2,080 13
CNY – Yuan Renminbi 22 1,583 100 4,900 49
COP – Colombian Peso 2 90,000 30,000 150,000 5
CZK – Czech Koruna 1 8,000
EGP – Egyptian Pound 4 1,288 750 2,000 3
EUR – Euro 465 581 10 3,300 330
GBP – Pound Sterling 467 1,272 100 3,150 32
IDR – Rupiah 219 568,842 50 5,000,000 100,000
INR – Indian Rupee 23 4,030 50 17,500 350
IQD – Iraqi Dinar 6 43,363 50 125,000 2,500
IRR – Iranian Rial 34 5,916,176 250 150,000 600
JPY – Yen 6 98,333 5,000 135,000 27
KRW – Won 8 221,500 42,000 300,000 7
KZT – Tenge 1 2,000
MDL – Moldovan Leu 5 250 250 250 1
MXN – Mexican Peso 4 2,070 150 5,600 37
MYR – Malaysian Ringgit 1 250
NGN – Naira 2 5,500 5,000 6,000 1
Currency # journals APC average Range – low Range – high Range ratio high / low
NOK – Norwegian Krone 5 9,800 4,000 14,000 4
PKR – Pakistan Rupee 3 1,667 1,000 3,000 3
PLN – Zloty 21 531 40 1,230 31
RON – New Romanian Leu 3 217 150 300 2
RSD – Serbian Dinar 1 15,000
RUB – Russian Ruble 16 6,359 300 19,000 63
SAR – Saudi Riyal 1 1,093
THB – Baht 1 243 120 450 4
TRY – Turkish Lira 4 2,500
TWD – New Taiwan Dollar 3  2,333 1,000 3,000 3
UAH – Hryvnia 33 542 40 2,000 50
USD – US Dollar 1,539 1,035 1 5,000 5,000
VEF – Bolivar 1 7,500
XAF – CFA Franc BEAC 1 100,000
ZAR – Rand 41 4,776 200 10,550 53
Total (journals); average (range ratio) 3,131 3,781

Table 1. APC average, range and range ratio by currency

Average APC in USD

The average APC in USD was $937; the median (mid-point) and mode (most common APC) were both $600.

In comparison with our 2014 survey of journals listed in DOAJ with APCs (Morrison et al, 2015):

  • the percentage of journals listed in DOAJ that charge APCs is nearly identical (26% in 2014, 28% in 2018)
  • the average (mean) APC in USD is nearly identical $964 in 2014 versus $937 in 2018 (see limitations)
  • the mode (most common) APC was reported as $0 in 2014 and is $600 USD in 2018 (see limitations)

The wide range of APC within most currencies lends support to the conclusion of our 2014 APC survey (Morrison et al, 2015) that the APC market at the current time is volatile. This makes prediction of future trends, necessary for budgeting purposes for those support this model, difficult.

Limitations

2014 data is drawn from publisher websites rather than DOAJ. The finding of a mode of $0 in 2014 was based on inclusion of APC-based publishers who are planning to charge APCs, but had not yet begun to do so. In 2018, it is not clear how or if this model would be captured by DOAJ metadata. For this reason, the significance of the difference in mode and the near identical APC amounts in USD should be interpreted with caution.

DOAJ metadata on APCs reflects a necessary simplification of complex data. DOAJ has 2 fields for publication costs, APC and submission fees, and one currency listing. However there are a wide variety of publication fee models in use, including per-page rather than per-article costs. Many journals still publish in print and have print-based publication costs such as extra charges for images and/or colour. Multiple prices including pricing in different currencies is common, as is different pricing based on such factors as type or length of article, discounts for developing countries, for society or institutional members; the wide variety of models was covered in some detail in Morrison et al. (2015). It is not clear how often DOAJ metadata on APC amounts is updated, and there could be differences between journals and publishers with respect to the frequency of updates. For this reason collecting data from journal and publisher websites will continue to be necessary for the OA APC project.

* in previous years Bank of Canada rates were used, however currently currency conversion options for previous years seem to be limited.

References

Mitchell, D. (2018). Personal e-mail. February 2, 2018

Morrison, H.; Salhab, J.; Calvé-Genest, A.; Horava, T. (2015). Open Access Article Processing Charges: DOAJ Survey May 2014. Publications 3, 1-16.

Biographical information and acknowledgements

Heather Morrison is an Associate Professor at the University of Ottawa’s School of Information Studies http://arts.uottawa.ca/sis/ and Principal Investigator of the Sustaining the Knowledge Commons (SKC) sustainingknowledgecommons.org research program sponsored by Canada’s Social Sciences and Humanities Research Council (SSHRC) via an Insight Grant (2016 – 2021). Heather is an open access advocate, and the purpose of the SKC project is to facilitate the economics of transition of scholarly publishing to support a sustainable global open access knowledge commons. Thanks to the SKC and DOAJ teams who do most of the work that makes this research possible.

To download a PDF version:

DOAJ 2018 overview blogpost

Cite as: Morrison, H. (2018). DOAJ APC information as of Jan 31, 2018. Sustaining the Knowledge Commons / Soutenir Les Savoirs Communs. Retrieved from https://sustainingknowledgecommons.org/2018/02/06/doaj-apc-information-as-of-jan-31-2018/


Springer Nature

Springer Nature 2017 APC Report

Springer Nature was formed in 2015 through the merger of Nature Publishing Group, Palgrave Macmillan, Macmillan Education and Springer Science+Business Media. The company is a leading global research, educational and professional publisher. It describes itself as “the publisher of the world’s most influential journals and a pioneer in the field of open research”. It claims to have over 3000 journals and 7 million articles.

The company offers three publishing platforms; SpringerLink.com, Nature.com and open access journals BioMed Central (BMC) and Springer Open platforms.

Analysis of 2017 open access journals does not reveals major changes in reported APC, except for Nature Research open access journals where 22 journals saw reduction in APC and one reported an increase. Average APC at Nature Research was $3103.00 a decrease of 11% from 2016. BioMed central APC increased on 4 journals and decreased on two journals, with average APC of $2189.00. Springer Open APC saw an increase on 8 journals and decrease on one journal with average APC stand at $1301.00

Average APC 2017

In 2017, Nature Research added 4 new journals and removed 2 journals. BioMed Central added 15 new journals and removed 17, while Springer Open added 12 new journals and removed 20. Over 40% of Springer Open journals are fully sponsored.

Number of Journal

Nature Research open access journals 2017

(http://www.nature.com/openresearch/publishing-with-npg/nature-journals/

On April 30th, 2017, the webpage listed 87 journals under four categories: Multidisciplinary (3), Nature Partner Journals (25), Academic and Society Journals (20), Journals with hybrid open access options (39). APCs for all journals were posted in US dollar, British Pound and European Euro.

For consistency purpose, we compared journals from the first three categories (48) with journals from the same categories analysed in 2016 (46). Journals with hybrid open access were not compared. Our APCs comparison was based on US Dollar.

Findings:

  • 4 new journals were added in 2017 to Nature Partner Journals category
  • 2 Journals were removed in 2017 from Academic and Society journals category
  • APC increased on one journal in 2017
  • APC decreased on 22 journals
  • APC remained the same for 20 journals
  • Lowest APC:       US$ 1350.00 for Scientific Data (same as in 2016)
  • Highest APC:      US$ 5200.00 for Nature Communications (same as in 2016)
  • Average APC:     US$ 3103.00 (Decreased by 11% from 2016)

The chart below shows a sample of the journals that were compared.

Nature Research OA 2017 APCs

BioMed Central 2017

https://www.biomedcentral.com/journals

On April 4th, 2017, BioMed Central listed 305 open access journals on its website under 14 categories: Biomedicine, Chemistry, Dentistry, Education, Engineering, Environment, Life Sciences, Materials Sciences, Mathematics, Medicine & Public Health, Pharmacy, Philosophy, Physics and Psychology.

The 2017 journals APCs were compared with the 2016 list consisting of 306 journals. APCs were posted in US Dollar, British Pound and European EURO. Our comparison is based on the posted US Dollar.

Findings:

  • 15 New journals were added in 2017
  • 17 Journals from 2016 are removed from 2017 list
  • APC increased for 4 journals
  • APC Decreased for two journals
  • APC remained constant on remaining journals
  • APC for 3 journals were removed in 2017
  • APC for 3 journals were added in 2017
  • APC for 3 journals were increased in 2017 and posted in Euro only
  • One journal posted no APC
  • Lowest APC:       US$ 860.00
  • Highest APC:      US$ 2975.00
  • Average APC:     US$ 2189.00

BMC 2017 APCs

The chart below shows a sample of the BMC journals that were compared.

BMC 2017 APCS in Posted currencies

Springer Open 2017

https://www.springeropen.com/journals

SpringerOpen listed 228 journals on its website under 26 categories: Biomedicine, Business and Management, Chemistry, Computer Science, Criminology and Criminal Justice, Dentistry, Earth Sciences, Economics, Education, Energy, Engineering, Environment, Geography, History, Law, Life Sciences, Linguistics, Materials Science, Mathematics, Medicine & Public Health, Philosophy, Physics, Political Science and International Relations, Psychology, Social Sciences, and Statistics.

The 2017 posted APCs were compared with 2016 APCs. APCs were posted in three currencies; British Pound, US dollar and European Euro. We performed the analysis using the US dollar currency.

Findings:

  • 12 new journals were added in 2017
  • 20 journals existed in 2016 are not included in 2017 list
  • APCs increased for 8 journals
  • APCs decreased for one Journal
  • APCs remained constant on 114 Journals
  • APCs was added to 5 journals in 2017 that had no APC in 2016
  • APCs were removed in 2017 from 3 journals that had APC value in 2016
  • 98 journals are fully sponsored (42.9%)
  • Lowest APC:       US$ 645.00
  • Highest APC:      US$ 2500.00
  • Average APC:     US$ 1301.00

Spinger Open 2017 APCs

Chart below represent a sample of Springer Open 2017 APCs in posted currencies

Sample of Springer Open 2017

Cite as: Merhi, S. (2017). Springer Nature. Sustaining the Knowledge Commons / Soutenir Les Savoirs Communs. Retrieved from

Merhi, S. (2017). Springer Nature. Sustaining the Knowledge Commons / Soutenir Les Savoirs Communs. Retrieved from https://sustainingknowledgecommons.org/2017/07/21/springer-nature/

Fréquences des pays et des devises dans: OA 2016 Main Publishers

Fréquences par pays

Cet article est le résultat de nos recherches dans la base de données 2016 OA Main DOAJ. Notre objectif est de présenter l’apport au niveau mondial et africain. 125 pays ont fourni 12037 revues. La contribution africaine est de 18 pays africains avec 235 revues. Nous avons calculé la fréquence et le pourcentage que représente chaque pays dans cette base de données. Nous avons aussi analysé les tendances des devises et les frais de publication qui ont été utilisées. De façon aléatoire, nous avons divisé les pays en 4 séries pour faciliter nos analyses. La première série est composée de 29 pays, la deuxième 30, la troisième 29, la quatrième 37. Trois pays arrivent en tête des fréquences (Brazil-1059 ; United States-1043 ; United Kingdom-749). Les plus faibles fréquences apparaissent une seule fois dans la série 1.

Les tableaux et les graphiques ci-dessous présentent les fréquences et le taux de pourcentage de chaque pays.

doc 1

doc1-1

seri2

seri 2

doc3-1

doc 3

doc4-1

doc 4

Frais de publication

Deux séries de frais de publication présentent notre analyse sur les dénominations attribuées aux frais de publication. Une première est composée de 7 catégories : No cost found, No publication fee, Title not Found, APPC, F(WC), cost not specified et Publication fee. La deuxième est composée de 11 catégories. Cette deuxième série regroupe les qualifications que des chercheurs qui ont exprimé lors de leur analyse de la base de données. Vu que certaines catégories répondent aux mêmes appellations que d’autres, nous avons décidé de les fusionner. Ainsi : See next phase of journal et predecessor now npj Primary Care Respiratory Medicine sont fusionnées pour donner : predecessor now npj Primary… Formula based on work, cannot read (Chinese), cannot confirm due to language (Chinese only), conflicting information et coming in 2017 sont fusionnée pour donner Autres. Ceased publication in May 2016, ceased publication in 2014, discontinued, et active 2015 donne Title not found. Enfin, No publication fee et APPC, F(WC) pour donner No publication fee. Résultat, No Publication fee est le plus fréquent avec 7785 soit 65%. Publication fee obtient 27% avec 3260 fréquences.

Le tableau et le graphique ci-dessous dressent la liste de ces tendances.

Capture d_écran 2017-04-19 à 23.18.35

Tendance des Devises

Notre analyse montre aussi que la devise des États-Unis (USD) est la plus fréquente avec 1997 fois citées. Elle est suivie de celle de la Grande Bretagne (GBP) 415 fois. Nous avons trouvé 40 revues qui ont des frais de publication mais dont la devise n’y figure pas.

devies 1

devise-12

II-African Journals In OA Main 2016

Nombre de pays et journaux

Nous avons compté 18 pays africains dans la base de données de OA Main 2016. L’Afrique du sud possède 120 journaux, le Nigeria, 27 et l’Egypt 27. Nous avons exclu toutes les revues concernant l’Égypte dans la revue Hindawi ne sont pas comprises, parce qu’elles ont une origine autre que l’Afrique.

Les détails dans le tableau et le graphique ci-dessous.

devis 1

Les fréquences des pays qui sont cités sont répertoriées dans le tableau et le graphique ci-dessous.

africa1-2

Fréquences APC Afrique

Sur un total de citations de 221 fois. Les fréquences des frais de publication sont les suivantes : No publication fee est cité 113 fois soit 51%. APC fee est cité de son côté 68 fois soit 31%. Title no found 8 soit 3,5%, No cost found 23 soit 10% wt APPC 9 soit 4%.

Le tableau et la graphique ci-dessous décrivent les tendances.

apc afric 1

III-Conclusion

L’examen de la base de données de OA 2016 Main Publishers nous a montré que 125 pays on fourni 12037 revues. Le Brésil est 1059 fois plus fréquent et les États-Unis 1043 fois. L’Afrique a contribué pour 235 revues. Onze catégories de dénominations de frais de publication ont été identifiées. La devise des États-Unis (USD) y est citée 1997 fois. L’Afrique du sud totalise 104 fréquences et sa devise ZAR 30 fois. La participation de l’Afrique pour les revues sans frais est de 51% par rapport à sa contribution totale.

PDF de L’article

Frenquencies In OA 2016 Main Publishers

Citation:

Kakou, T. L. (2017). Fréquences des pays et des devises dans: OA 2016 Main Publishers. Sustaining the Knowledge Commons / Soutenir Les Savoirs Communs. Retrieved from https://sustainingknowledgecommons.org/2017/04/20/frequences-des-pays-et-des-devises-dans-oa-2016-main-publishers/

Taylor & Francis bought Co-Action Publishing

In the last year, Taylor and Francis announced that Co-Action Publishing will be part of their portfolio for 2017.

Caroline Sutton, co-founder of Co-Action Publishing is now the Head of Open Scholarship Development in Taylor & Francis Group. It appears that the journals that were published by Co-Action Publishing are now merged in Taylor & Francis’ brand and not as a separate imprint.

According to Open Access Scholarly Publishers Association, Co-Action Publishing was publishing 34 journals and more than 2000 open access articles per year.

References :

http://taylorandfrancis.com/co-action-message

http://oaspa.org/member/co-action-publishing/

Cite as:

Laprade, K. (2017). Taylor & Francis bought Co-Action Publishing. Sustaining the Knowledge Commons / Soutenir Les Savoirs Communs. Retrieved from https://sustainingknowledgecommons.org/2017/04/11/taylor-francis-bought-co-action-publishing/

SAGE Publications 2016 & 2017 Data Analysis (including Libertas Academica)

Update December 18, 2017: CLOCKSS has announced that 21 former Libertas Academica Journals have been triggered for OA through CLOCKSS as they are no longer published by Sage. The titles are:

· Advances in Tumor Virology
· Cell & Tissue Transplantation & Therapy
· Cell Communication Insights
· Clinical Medicine Insights: Geriatrics
· Clinical Medicine Reviews in Cardiology
· Clinical Medicine Reviews in Oncology
· Clinical Medicine Reviews in Patient Care
· Clinical Medicine Reviews in Therapeutics
· Clinical Medicine Reviews in Vascular Health
· Clinical Medicine Reviews in Women’s Health
· Gene Expression to Genetical Genomics
· Glycobiology Insights
· Healthy Aging & Clinical Care in the Elderly
· Human Parasitic Diseases
· Journal of Genomes and Exomes
· Lymphoma and Chronic Lymphocytic Leukemias
· Organic Chemistry Insights
· Primary Prevention Insights
· Reproductive Biology Insights
· Retrovirology: Research and Treatment
· Translational Oncogenomics

(thanks to the Society for Scholarly Publishing listserv)

Abstract: SAGE, which defines itself as the “world’s largest independent academic publisher” on its website, bought Libertas Academica in 2016, which is one step in moving to the open access space. SAGE publishes more than 1000 journals and offer the possibility of hybrid gold open access publishing for almost all of them. 165 journal published by SAGE are in fully open access.

In 2016, around 86% of fully open access journals have an APC. The APC average is 1084 USD.

In 2017, around 84% of fully open access journals have an APC, but only 16% of those have an APC in DOAJ. Of the APCs available in DOAJ, around 33% varies from the APCs found in SAGE. Less than 2% of fully open access journals have an APPC.

Only 2 journals published by SAGE do not have publications fees.

SAGE Journals

The APC average for fully open is 1011 USD (excluding the journals from Libertas Academica). For SAGE Choice hybrid option, SAGE website says the APCs is 3000 USD. There are some pricing exceptions in the SAGE Choice hydrid option. The average for those journals is 1275 USD. The average for the journals previously published by Libertas Academica is 1784 USD

A comparison between 2016 and 2017 data for Libertas Academica journals, now owned by SAGE, show no variations in prices for the same journals. However, the 2016 data is missing 7 journals from its list that appear on the 2017 data. 6 of these journals are no longer in Open Access model. 1 journal has a 1085 USD APC.

Full text here.

Cite as:

Laprade, K. (2017). SAGE Publications 2016 & 2017 Data Analysis (including Libertas Academica). Sustaining the Knowledge Commons / Soutenir Les Savoirs Communs. Retrieved from https://sustainingknowledgecommons.org/2017/04/11/sage-publications-2016-2017-data-analysis-including-libertas-academica/