Sabinet – Comprendre le fonctionnement de l’industrie de l’information en Afrique

De nos jours, les sites web constituent des supports importants pour la diffusion d’information. Les entreprises s’attèlent à donner une visibilité à leurs produits. Les plateformes sont les lieux où les compagnies proposent une variété de produits. L’industrie de l’information en Afrique dans leur conversion au numérique utilise des plateformes pour proposer des services. C’est l’exemple de Sabinet qui est une plateforme hybride qui publie des revues africaines en ligne depuis 2001 (Sabinet, 2019). Elle commercialise trois Produits:

  • Service bibliothécaire: Catalogage – l’interconnexion – gestion des bibliothèques, etc.  
  • Service d’information: 500 revues en ligne – 150 000 articles spécialisées de recherche complétée, de thèses & de Mémoires – Articles de médias et textes législatifs, etc.
  • Service de numérisation: Du scannage à la gestion des données.

La collection est composée de 10 suivantes disciplines: Business and Finance, Education, Labour, Law, Medicine and Health, Science – Technology and Agriculture, Religion, Social Sciences and Humanities et Juta’s Law Journals (Sabinet, (c), 2019).

Notre objectif dans ce travail est de présenter le fonctionnement de Sabinet en suivant les quatre principaux éléments de critères d’évaluations pour les ressources électroniques sur le Web de The Charleston Advisor (2019) (Contenu, Tarif, Options du contrat / caractéristiques, Possibilité de recherche) (The Charleston Advisor, 2019).

Nous allons découvrir le contenu de Sabinet en présentant dans un premier temps, le service bibliothécaire, le service d’information et le service de numérisation. Dans un deuxième temps, nous indiquons les dispositions contractuelles notamment, les dispositions relatives aux prêts entre bibliothèques, redistribution des informations, ou autres questions particulières qui accompagnent les différents services que Sabinet offre à ses clients. Notamment l’interface utilisateur et le moteur de recherche ainsi que quelles conditions d’accès aux produits.

1 – Présentation de Sabinet

Sabinet est une entreprise de l’industrie de l’information en Afrique du Sud. Sa mission est de faciliter l’accès à l’information et de faire en sorte que les bibliothèques en Afrique. La compagnie fonctionne par actionnariat (Institutions 49%, Personnel 37%, Fiducie 9%, Particuliers 5%). Le conseil d’administration est composé de 10 membres et une équipe de gestion de 8 membres. 213 éditeurs issus de 12 pays publient 500 revues (350 000 articles). De ses 500 revues, 164 sont en accès libre, 336 revues sont accédées par souscription (Sabinet, (b), 2019).

L’un des services que propose Sabinet à ses clients est la gestion des bibliothèques. Ce qui lui permet le catalogage et l’interconnexion.

Services aux bibliothèques

Sabinet fournit une variété de services à tous les types de bibliothèques. Elle offre le catalogage et l’acquisition de l’information pour les bibliothèques pour simplifier et soutenir leur processus de développement de leurs collections. Sabinet propose des services aux bibliothèques incluant l’interconnexion et les systèmes de gestion des bibliothèques. Elle procure des plateformes de collaboration de ressources entre les bibliothèques. Un service de partage de ressources basé sur le Web pour les bibliothèques de l’Afrique australe, «the ReQuest interlending service» facilite l’accès aux ressources hébergées par les bibliothèques, en permettant l’emprunt et le prêt entre les institutions. Le prêt inter-bibliothèque «WorldShare» d’OCLC relie les utilisateurs aux collections de milliers de bibliothèques via le plus grand réseau de prêts inter-bibliothèques au monde. Sabinet est un site de partage de documents d’échange d’articles. Elle fournit un emplacement unique et sécurisé où les bibliothèques de prêt du monde entier peuvent placer les documents. Hormis le service aux bibliothèques, Sabinet gère également un service d’information dans lequel les éditeurs peuvent publier leurs revues.

Services d’information

            Sabinet offre des revues en ligne provenant ou se rapportant à l’Afrique. Ce service est l’une des collections les plus complètes et consultables en ligne en texte intégral. Elle contient du contenu juridique sud-africain, ainsi qu’un service d’archivage des médias (SA Media). SA Media est un service de recherche de nouvelles et de coupures de presse qui couvre rétrospectivement les principales publications en Afrique du Sud, de 1978 à nos jours. La collection de presses SA Media comprend plus de 4,5 millions d’articles. Avec une moyenne de 2 500 nouveaux articles ajoutés chaque semaine, SA Media est un outil de recherche qui donne accès aux publications traditionnelles locales (Sabinet, (f) 2019).

Collection

Nombre Disciplines OA N S T Total
1 Social Sciences and Humanities 37 122 0 0 159
2 Science Technology & Agriculture 28 78 0 0 106
3 Medicine and Health 16 70 0 0 86
4 Business and Finance 14 75 0 0 89
5 African Journal Archive 127 54 0 0 181
6 Law 17 38 0 0 55
7 Labour 6 14 0 0 20
8 Religion 5 26 0 0 31
9 Education 3 13 0 0 16
10 Juta’s Law Journals 0 16 0 0 16
  Total 253 506 0 0 759

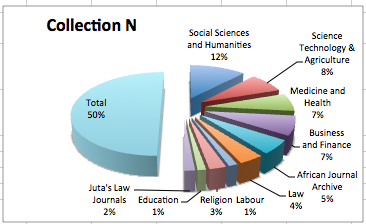
La collection de Sabinet est composée de 10 disciplines. Les champs de African Journal Archive (181) et de (Social Sciences and Humanities (159)) arrivent en tête du nombre des catégories de sujet et sont toutes évalués par les pairs (peer reviews). Sabinet s’adresse spécifiquement aux chercheurs et aux bibliothèques. Cette compagnie soutient les écoles secondaires et primaires à travers des dons de livres spécialisés. Dans ce contexte, Sabinet propose de numériser les documents papier des différentes institutions ou compagnies pour leur donner une visibilité en ligne.

Numérisation

Sabinet offre un service de numérisation personnalisé pour les besoins des bibliothèques. L’équipe chargée de la numérisation dispose d’un équipement de pointe qui leur permet de créer des répliques électroniques parfaites du matériel d’origine. Environ 13 000 pages A4 détachées ainsi que 1 200 pages liées peuvent être numérisées quotidiennement (Sabinet, (h) 2019). Sabinet dispose d’un système (CONTENTdm®) qui donne accès aux collections numériques sur le Web, plus rapidement. Il peut gérer tout format – archives d’histoire locale, journaux, livres, cartes, bibliothèques de diapositives ou audio / vidéo.  Ce système fournit une solution complète pour les archives historique, les bibliothèques de diapositives, les articles «nés-numériques», les journaux, les livres, les lettres, les cartes, les thèses et les dissertations électroniques et les fichiers audio / vidéo. Il permet l’interopérabilité. Autrement dit, il est compatible avec les systèmes existants, locaux, régionaux, nationaux et internationaux. Il est compatible aux normes ISO, notamment : Unicode, Z39.50, Dublin Core®, XML, JPEG2000, etc. (Sabinet, (i) 2019).

Ces services ont pour objectif de fournir et de garantir les meilleures conditions de travail pour les usagers. Les dispositions techniques de navigation et d’accès à la documentation sont proposées à tous les souscripteurs qui souhaitent travailler avec Sabinet.

2 – Dispositions contractuelles

La plateforme Sabinet est hybride, certains articles sont payants. L’accès aux documents payants est soit par abonnement soit directement (open accès). Pour gérer le flux de clients, une souscription avec un «username» et un mot de passe sont exigés. Il y a un panier dans lequel tout souscripteur peut collectionner les articles qu’il souhaite acheter (Sabinet (e), 2019). Le système de fonctionnement de Sabinet est entièrement basé sur des logiciels et des technologies Open Source. Par exemple, Counter fournit le code de pratique qui permet aux éditeurs et aux fournisseurs de signaler l’utilisation de leurs ressources électroniques de manière cohérente. Cela permet aux bibliothèques de comparer les données reçues de différents éditeurs et de fournisseurs. Counter maintient les registres de conformité qui répertorient les éditeurs et les fournisseurs qui ont passé une vérification indépendante de leurs statistiques d’utilisation.

EZproxy est un autre outil qui est installé sur un serveur. Il sert d’intermédiaire entre l’usager et le fournisseur de ressources numériques. L’adresse du serveur sur lequel est installé EZproxy est déclarée auprès des fournisseurs de contenus qui autorisent alors l’accès à tout utilisateur arrivant depuis ce serveur. L’authentification est confiée à l’établissement responsable d’EZproxy, via un annuaire LDAP. EZproxy fonctionne en modifiant dynamiquement les URL dans les pages Web fournies par le fournisseur. Il configure l’accès pour que l’interaction et l’engagement des utilisateurs avec la bibliothèque soient les mêmes, où qu’ils se trouvent et quand ils choisissent de travailler.

 Le processus d’installation est sécurisé pour les utilisateurs, il n’est pas nécessaire pour les utilisateurs de modifier les paramètres de leur navigateur ou de reconfigurer leur PC. L’utilisateur se connecte au contenu sans de multiples barrières. Le mot de passe est supprimé. EZproxy peut être configuré avec les principaux services d’authentification – LDAP, SIP et Shibboleth, de sorte que l’utilisateur n’ait pas à se souvenir de plusieurs mots de passe.

Les services de ce site sont compatibles avec les produits du «link resolvers/OpenURL» et des principaux systèmes de bibliothèque, y compris ceux de Serials Solutions, ExLibris, EBSCO et OCLC. Le «link resolvers/OpenURL» permet aux systèmes de bibliothèque de se lier au niveau de l’article du journal (ou aux titres de livres) en utilisant une syntaxe OpenURL. L’utilisation de cette méthode est avantageuse, en particulier lors de la liaison avec un contenu récemment publié puisqu’il ne nécessite pas que l’article soit préalablement téléchargé (Sabinet, (g) 2019). 

Cette initiative internationalement acceptée facilite l’enregistrement et la déclaration des statistiques d’utilisation en ligne de manière cohérente et crédible. Le service devient plus simple pour les clients afin de comprendre et d’analyser comment les livres électroniques et d’autres matériaux électroniques sont utilisés. Lorsque les rapports d’utilisation ont les mêmes types de données et sont formatés de la même manière, ils peuvent être comparés les uns aux autres et peuvent être automatiquement récupérés dans les systèmes locaux (NISO, 2019).

Outre ces dispositions techniques, Sabinet propose aux utilisateurs un moteur de recherche performant qui facilite la navigation.

L’interface utilisateur et le moteur de recherche

Le site web de Sabinet demande une inscription pour naviguer sans restrictions. Au niveau de la principale page qui est intitulée «Sabinet : Faciliting Access to Information», six (6) menus permettent de se connecter et de visiter le site. L’onglet «Home» raccourcit l’accès à cinq (5) menus. Par exemple, «About» présente entre autres la mission, l’équipe dirigeante, etc. «Products and Services» énumère le programme de ses trois services en l’occurrence : Library Solutions, Information Services and Digitization. Ensuite, le «Support» définit les différentes informations les politiques d’accès, d’authentification et des pratiques de prêts entre les autres bibliothèques. «New and Events» fournit les informations sur les activités et communications du site. Quant à «Corporate Social Investment», il décrit le projet de Sabinet.

En plus de ces menus sur la page, trois services (African Studies Collection, Online journal, News Services) sont proposés. African Studies Collection est une collection d’un large éventail de revues spécialisées, de médias et de contenus législatifs émanant du continent africain. Online journal propose des revues en ligne en provenance ou à destination de l’Afrique. Sabinet propose un nouveau service (News Services) personnalisé de recherche d’informations en ligne et de coupures de presse pour répondre aux divers besoins.

Ce nouveau service comprend:

La nouvelle base de données de African News Agency (ANA). Elle comprend : des rapports en texte intégral de novembre 2015 à ce jour sur l’actualité sud-africaine et africaine. Elle donne accès aux articles de presse importants de l’ancienne SAPA (ANA est le nouveau nom de SAPA). Ces articles  sont issus de cinq disciplines clés: la politique, l’économie, les entreprises et les marchés, le sport ainsi que l’actualité générale (qui comprend le mode de vie, les célébrités, les tribunaux et la criminalité). Les nouvelles des agences suivantes sont diffusées via l’Agence de presse africaine: ANA, ANA-Xinhau, ANA-dpa international et ANA-Associated Press.

Pour obtenir des informations sur les éditeurs, la collection, les publications, etc., il faut se rendre à la page intitulée «Sabinet African Journals» avec 7 menus : 

  • le menu «A-Z Publications» donne la liste des revues ou bien montre comment soumettre un article;
  • le menu «Collections» donne la liste des collections principales;
  • le menu «Open Access» indique les revues Open Access; de la politique d’accès, etc.
  • le menu «Publishers» dresse la liste des éditeurs;
  • le menu «For Librarians» présente les politiques d’accession aux informations pour les bibliothécaires;
  • l’onglet «Help» revient sur les conditions de souscription et du guide des utilisateurs;
  • enfin, le menu «Shopping Cat» permet de réserver les articles que l’on souhaite avoir.

En plus de ces menus sur la page, un autre onglet situé au-dessus de la bande à menus donne accès à «Advanced Search». Elle permet de filtrer les recherches par collection, par date, etc. (Sabinet, (d), 2019). Les utilisateurs de la bibliothèque peuvent récupérer des articles ou des chapitres de livres via un prêt entre bibliothèques. Cette possibilité d’accès est possible grâce à un dispositif technique diversifié, mais aussi, à un modèle d’affaires que propose Sabinet.

Tarification

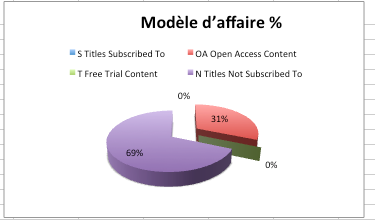
Le modèle d’affaires de Sabinet est basé sur trois possibilités d’accès à la collection. Il y a premièrement, des abonnés et deuxièmement des non-abonnés. Les abonnés ont accès à l’intégralité des revues et les non-abonnés payent pour accéder à des contenus. Troisièmement, on trouve les revues à accès libre. Les revues en accès libres sont divisées en trois modes d’accès : le «Gold Open Access» est dépourvu de toutes restrictions. Le «Green Open Access» est un accès semi-libre. Les éditeurs facturent des frais d’abonnement pour les récents numéros pendant une période donnée. Ensuite, l’accès devient gratuit.

Le troisième mode d’accès libre est «Article level Open Access». Ici, certains articles sont libres d’accès et d’autres sont payants. Pour soumettre un article à Sabinet, l’organisation demande à tout souscripteur de contacter directement un éditeur via leur site pour effectuer l’envoi. Il est accessible par ordinateur PC ou Machintosh. L’essentiel de sa clientèle est composé de bibliothèques locales et internationales, ainsi que des organismes publics et privés (Sabinet, (e) 2019). Les revenus de Sabinet proviennent aussi des frais de souscription ou des abonnements des bibliothèques.

       Modèle d’affaires

OFFRES TYPES NOMBRE DE REVUES
S Titles Subscribed To 0
OA Open Access Content 164
T Free Trial Content 0
N Titles Not Subscribed To 360

CONCLUSION

Sabinet a pour mission de promouvoir l’accès à l’information des recherches en Afrique. Dans ce sens, la plateforme remplit parfaitement ses objectifs. Elle diffuse 500 revues dont plus 164 en accès libre, 336 par souscription avec des frais pour le téléchargement. La grande partie des revues est issue de l’Afrique du Sud avec 184 sur 213 éditeurs. Sabinet offre une variété de services avec d’importantes possibilités d’accès. Cependant, l’accès renferme des imperfections qui ne facilitent pas l’utilisation des services. Une des  particularités est que les menus de l’interface ne donnent pas accès facilement aux revues. La fonctionnalité «Home» propose cinq menus dans lesquels il faut aller chercher pour trouver la liste des revues, des éditeurs, etc. De plus, l’on ne peut pas obtenir ces revues par pays sur une facette. Sabinet est une compagnie qui offre également d’autres services payants comme la numérisation, le catalogage, des documents des bibliothèques, etc.  Cependant, les frais de publication ou autres frais de service ne sont pas affichés.

Les produits compétitifs de Sabinet sont leurs trois services phares, notamment : la numérisation, le service d’information et le service aux bibliothèques. Ces produits permettent de soutenir leurs différents projets de bienfaisance aux établissements scolaires, à la création de l’emploi  et à la diffusion des produits de recherches de l’Afrique (Sabinet, (f), 2019). 

Références

NISO, (2019). How the Information world Connects – SUSHI FAQs: General Questions http://www.niso.org/workrooms/sushi/faq/general/#q4 Visité le 20/11/2019
Sabinet,  (2019) (a). Sabinet : Facilitating Access to Information https://sabinet.co.za Visité le 20/11/2019
Sabinet,  (2019) (b). Ownership. https://www.sabinet.co.za/index.php/ownership Visité le 20/11/2019
Sabinet, (2019) (c).Collection Contents http://journals.co.za/content/collection/african-journal-archive Visité le 20/11/2019
Sabinet,  (2019) (d).  Sabinet African Journals https://journals.co.za/Visité le 20/11/2019
https://sabinet.co.za/index.php/information-services/online-journals/sa-epublications
Sabinet,  (2019) (e). EZproxy https://www.sabinet.co.za/library-solutions/authentication-management
Visité le 20/11/2019
Sabinet, (2019) (f). SA Media https://www.sabinet.co.za/information-services/news-research-services/sa-media Visité le 20/11/2019
Sabinet, (2019) (g). Librarian FAQ. shttp://journals.co.za/librarians-faq Visité le 20/11/2019
Sabinet, (2019) (h). Scannage services. https://sabinet.co.za/digitisation/scanning-services Visité le 20/11/2019
Sabinet, (2019) (i). About Digitisation. https://sabinet.co.za/digitisation/about-digitisation Visité le 20/11/2019
The Charleston Advisor, (2019) (j). TCA Scoring Guide. http://www.charlestonco.com/index.php?do=About+TCA&pg=ScoringGuide Visité le 20/11/2019

OA APC longitudinal survey 2019

OA APC longitudinal survey 2019

Summary

This post presents results of the 2019 OA APC longitudinal survey and extends an invitation to participate in an open peer review process of the underlying data and its documentation. One thing that is not changing is that most OA journals in DOAJ do not charge APCs: 10,210 (73%) of the 14,007 journals in DOAJ as of Nov. 26, 2019 do not have APCs. The global average APC in 2019 is 908 USD. This figure has changed little since 2010, however this consistency masks considerably underlying variation. For example, the average APC in 2019 for the 2010 sample has increased by 50%, a rate three times the inflation rate for this time frame. The tendency to charge or not to charge, how much is charged and whether prices are increasing or decreasing varies considerably by journal, publisher, country of publication, language and currency. One surprise this year was the top 10 countries by number of OA journals in DOAJ. As usual, Europe, the US and Latin America are well represented, but Indonesia is now the second largest country in DOAJ and Poland, Iran, and Turkey are among the top 10, perhaps reflecting the work of the DOAJ ambassadors. Pricing per journal shows mixed trends; most journals did not change price between 2018 and 2019, but there were price decreases as well as increases. The UK’s Ubiquity Press stands out as having a relatively low APC (a fraction of Oxford’s, another UK-based publisher) and no price increases.

Documentation, link to dataset and open peer review invitation

Overview

The Sustaining the Knowledge Commons team has been gathering data on OA APCs since 2014 and merging data from DOAJ and other researchers into the main dataset. Singh & Morrison (2019) note that the majority of fully OA journals do not charge; of those that do, the global average APC is 908 USD, a figure that has changed very little since 2010. In contrast, the mode (most common APC) shows quite a bit of variation and the maximum has been increasing for both APC and APPC (article page processing charge). This suggests that there is something else going on.

Shi & Morrison’s (2019) findings illustrate that charging trends can vary considerable by publisher. 4 pairs of publishers and sub-publishers are compared. Two Wolters Kluwer imprints, Medknow and Lippincott, are quite different in APCs. Medknow journals tend not to charge, and those that have APCs tend to have relatively low APCs. Lippincott journals tend to charge, at above-average rates. Two universities, Indonesia’s Universitas Negeri Semerang (UNS) (now one of the largest publishers in DOAJ) and Oxford are compared. Oxford is one of the world’s oldest publishers, is UK based, and tends to charge APCs at above-average rates. UNS appears to be a newcomer to online publishing, uses the open source Open Journal System; UNS journals tend not to charge, and when they do charge, prices are relatively low. Oxford was also compared with another UK-based publisher, Ubiquity Press. Ubiquity Press is a new not-for-profit designed to produce OA works and also to achieve cost efficiency. It appears that Ubiquity is having success with the latter, as their average APC is a fraction of that of Oxford. MDPI and Hindawi are compared; both are new commercial APC-based publishers, but the average APC is much higher for Hindawi than for MDPI. This evidence supports the hypothesis that the global average APC masks considerable variation based on publisher history and strategy.

Avasthi & Morrison (2019) explore one of these publishers, Medknow, in more depth, and ask whether this approach is the best for India, the original home of the publisher before acquisition by Wolters Kluwer. It appears that the reason most Medknow journals do not have publication charges is because of numerous partnerships between Wolters Kluwer and scholarly societies and universities. Medknow has expanded beyond India, and has grown quite a bit in both 2018 and 2019. The number of “title not found” and a couple of “risky URL” (a code for when the URL on the publisher’s website leads to a website that is clearly not a journal and gives the appearance of a possible scam) raises some questions about whether the quality of service these journals receive are what they expect and deserve through a partnership with one of the world’s oldest EU-based commercial scholarly publishers.

Pashaei & Morrison (2019a) compare APCs by original currency. Over half of APC charging journals have USD as original currency, and 5 currencies account for more than 90% of APCs. Average prices by currency are translated into USD, and these prices vary quite a bit. APCs in GBP and more than twice as high as APCs in EUR.

Pashaei & Morrison (2019b) compare APCs (pricing and tendency to charge) by language. The tendency to charge varies quite a bit by language (first language listed in DOAJ). For example, 98% of journals in Spanish, Portuguese, French, and Czech do not have publication fees, while about a third of journals in English or Persian have APCs. The average APC for English-language journals is more than 3 times the second highest language-basis APC (Catalan).

Pashaei & Morrison (2019c) studied the correlation of country in DOAJ, OA journal publishing, and APC. As expected, Europe, the US, and Latin America are well represented in DOAJ. There were some surprises. Indonesia is now the second largest country in DOAJ, and Poland, Iran, and Turkey, are among the top 10. This may reflect the work of the DOAJ ambassadors’ program. Tendency to charge and average APC both vary quite a bit depending on the publisher in question.

Morrison (2019a) studied charging trends for journals with APC amounts for both 2018 and 2019 and found considerable variation. Most of these journals did not change in APC, but many decreased prices and many more increased prices. The tendency to increase prices was more marked for journals listed in DOAJ as of Jan. 31, 2019. An analysis of trends and average APCs for publisher with 2 or more journals in this set revealed very different patterns. A few publishers did not increase prices. Ubiquity Press stands out as having a relatively low price and no price increase. For some publishers, tendency to decrease and increase prices cancel each other out. 6 publishers had average price increases of more than 10%: Wolters Kluwer Medknow, MDPI, Oxford, Elsevier, BioMedCentral, and Frontiers.

Morrison (2019b) studied status and charging trends for journals included in Solomon & Björk’s (2012) 2010 study, limited to a sample of journals listed in DOAJ and charging APCs at that time. The majority of these journals are still active and charging. The average APC has increased in this time frame by 50%, more than 3 times the inflation. Not all journals have increased in price; some decreased and others remained the same price. Nearly a quarter of these journals have ceased or are not found. Most of this attrition appears to be due to new OA APC-based commercial publishers with a start-up strategy of publishing a wide range of journals, then retiring unsuccessful journals.

Kakou (2019) analyzes African based Sabinet using an approach inspired by The Charleston Advisor’s review series. Brief highlights: Sabinet’s mission is to promote access to information on African research. In this sense, the platform fills its objectives perfectly. It disseminates 500 journals of which 164 are open access, 336 subscription-based with pay-per-view. Most of the journals are from South Africa. Sabinet offers a number of services, including library management services.

Full documentation, link to open dataset, and invitation to participate in open peer review

Morrison, H. et al. (2019). OA Main 2019: Dataset, documentation and open peer review invitation. Sustaining the knowledge commons. https://sustainingknowledgecommons.org/2019/11/20/oa-main-2019-dataset-documentation-and-open-peer-review-invitation/

Dataset: Morrison, Heather, et al. 2019, “OA APC longitudinal study dataset 2019”, https://doi.org/10.5683/SP2/0DIPGE, Scholars Portal Dataverse, V1

Cite as: Morrison, H. et al. (2019). OA APC longitudinal survey 2019. Sustaining the Knowledge Commons. https://sustainingknowledgecommons.org/2019/11/27/oa-apc-longitudinal-survey-2019/

References

Avasthi, N & Morrison, H (2019). Medknow 2019 – is this the best for India? Sustaining the Knowledge commons. https://sustainingknowledgecommons.org/2019/11/23/medknow-2019-is-this-the-best-for-india/

Kakou, T.L. (2019). Sabinet – Comprendre le fonctionnement de l’industrie de l’information en Afrique. Soutenir les savoirs communs. https://sustainingknowledgecommons.org/2019/11/27/sabinet-comprendre-le-fonctionnement-de-lindustrie-de-linformation-en-afrique/

Morrison, H. (2019a). APC price changes 2019 – 2018 by journal and by publisher. Sustaining the knowledge commons. https://sustainingknowledgecommons.org/2019/11/26/apc-price-changes-2019-2018-by-journal-and-by-publisher/

Morrison, H. (2019b). 2010 – 2019 APC update. Sustaining the Knowledge Commons. https://sustainingknowledgecommons.org/2019/11/26/2010-2019-apc-update/

Pashaei, H. & Morrison, H. (2019a). Open Access in 2019: Original currencies for article processing charge. Sustaining the knowledge commons. https://sustainingknowledgecommons.org/2019/11/26/open-access-in-2019-original-currencies-for-article-processing-charge/

Pashaei, H. & Morrison, H. (2019b). DOAJ 2019: Language analysis. Sustaining the knowledge commonshttps://sustainingknowledgecommons.org/2019/11/26/doaj-2019-language-analysis/

Pashaei, H. & Morrison, H. (2019c). Open Access in 2019: Which countries are the biggest publishers of OA journals? Sustaining the knowledge commons. https://sustainingknowledgecommons.org/2019/11/26/open-access-in-2019-which-countries-are-the-biggest-publishers-of-oa-journals/

Shi, A & Morrison, H. (2019). APCs comparisons among different publishers in 2019. Sustaining the knowledge https://sustainingknowledgecommons.org/2019/11/26/apcs-comparisons-among-different-publishers-in-2019/

Singh, S. & Morrison, H. (2019). OA journals non-charging and charging central trends 2010 – 2019. Sustaining the knowledge commons. https://sustainingknowledgecommons.org/2019/11/23/oa-journals-non-charging-and-charging-central-trends-2010-2019/

Solomon, D. J. and Björk, B. (2012), A study of open access journals using article processing charges. J Am Soc Inf Sci Tec, 63: 1485-1495. doi:10.1002/asi.22673


2010 – 2019 APC update

by Heather Morrison

Summary

This is an update of the 2010 study of Solomon & Björk (2012) of a sample of 1,046 journals charging APCs listed in DOAJ at that time. 74% of these journals are still active and actively charging publication fees. The average APC reported by Solomon & Björk was 906 USD; the average in 2019 for the 739 journals for which we have APC data for both years is 1,363 USD. This represents a 50% price increase during this time frame, an increase that is 3 times the inflation rate. Not all journals increased in price; some decreased or remained the same price. Nearly a quarter of the journals (23%) are ceased or not found. Most of this attrition rate can be attributed to new OA APC-based commercial publishers with a start-up strategy involving roll-out of a broad range of journals, with unsuccessful journals being retired.

Download PDF:  2010 update

Research question: what is the status, charging tendency (to charge or not to charge) and pricing trends of these journals?

Method

A subset of the OA Main 2019 Dataset (Morrison et al., 2019) containing Solomon & Björk’s 2010 data was used as the basis for this study. This sample was compared with the 2010 data and journals missing from OA Main (due to having been dropped from DOAJ prior to our study) were added to complete the sample. The current status of journals was developed using a pivot table. Pricing trends for 739 journals (tendency to increase or decrease in price) that are still charging APCs was calculated separately for journals with matching original currency (to avoid conflation with currency fluctuations) and non-matching currency in USD. An attempt was made to estimate APC for the 31 journals currently charging APPC but abandoned as the results did not match the APC trends and there is not enough detail in the 2012 study to be certain that the method of estimating APC was correct.

Results

Status

As illustrated in the following table and chart, the majority (779 or 74%) of the 2010 journals are still active and actively charging publication fees. 242 (23%) titles are ceased or not found. 25 (2%) have a status of other. Of these, 8 journals are now non-charging (no publication fee), for 11 journals it was not possible to determine whether or not there is a charge (no cost found), 2 journals are now hybrid, 3 are inactive, and one has been merged with another journal.

2010 journals by 2019 status
Actively charging 779 74%
Ceased or not found 242 23%
Other 25 2%
Grand Total 1,046

Active APC journals: trends analysis

The average APC reported by Solomon & Björk (2012) for 2010 was 906 USD. 779 of these journals are still active and charging publication fees; of these, 739 are still charging APCs and we were able to identify the amount. The average APC for these 739 journals in 2019 is 1,363 USD. This represents a 50% increase in the average APC for this group of journals. According to the Bank of Canada (n.d.) currency calculator, the cumulative inflation rate from 2010 – 2019 is 16.35% An average increase of 50% is more than 3 times the inflation rate.

Pricing direction trend

Not all journals increased in price. As the following table illustrates, 75% of journals increased in price, 18% decreased in price and 8% had no change in price. Where possible, original currency was used to avoid conflation with currency fluctuations.

Pricing trends by number of journals Matching currency Non-matching currency Total % of total
Journals decreasing in price 56 75 131 18%
No change in price 57 0 57 8%
Price increase 393 158 551 75%
Total l# of journals 506 233 739

Ceased / title not found analysis

Ceased journals

Based on knowledge of the history of pioneering APC OA based publishers, a publisher type analysis was conducted of the 210 ceased journals. 199 or 95% of these journals were developed by such publishers that pursued a strategy of starting out their business with a broad range of journals, then dropping journals that were not successful. 7 or 3% of these journals were started by publishers that have been acquired by other publishers that did not continue all of the others. No pattern was discerned for 4 (2%) of the journals.

2010 journals ceased as of 2019 – publisher type analysis
Publishers with broad range of journals start-up strategy
Bentham open 143
BioMed Central 12
Dove Medical Press 10
Frontiers Media S.A. 3
Hindawi Limited 31
Total broad range strategy 199 95%
Publishers that were acquired by other publishers
Co-Action Publishing 1
Libertas Academica 6
Total publishers acquired by other publishers 7 3%
Other
Academic and Business Research Institute 2
SAGE Publishing 1
SpringerOpen 1
Total other 4 2%
Total ceased journals 210

Title not found

A similar analysis was conducted on the 32 “title not found” journals. There was some overlap in the results; Bentham Open, one of the publishers with a broad range of journals start-up strategy, accounts for half of the total, with BioMedCentral accounting for 3 of the titles.

References

Bank of Canada (n.d.) Currency calculator. https://www.bankofcanada.ca/rates/related/inflation-calculator/

Morrison, H. et al. (2019). OA Main 2019: Dataset, documentation and open peer review invitation. Sustaining the knowledge commons. https://sustainingknowledgecommons.org/2019/11/20/oa-main-2019-dataset-documentation-and-open-peer-review-invitation/

Solomon, D. J. and Björk, B. (2012), A study of open access journals using article processing charges. J Am Soc Inf Sci Tec, 63: 1485-1495. doi:10.1002/asi.22673

Cite as:  Morrison, H. (2019). 2010 – 2019 APC update. Sustaining the Knowledge Commons. https://sustainingknowledgecommons.org/2019/11/26/2010-2019-apc-update/

APC price changes 2019 – 2018 by journal and by publisher

by Heather Morrison

Abstract

Pricing trends for 2018 – 2019 were compared on a per-journal and per-publisher basis. In contrast to the relatively unchanging global average APC, per-journal and per-publisher shows a mixture of trends. Most journals did not change in price from 2018 to 2019; 13% increased in price, 25% decreased. Journals included in DOAJ showed a greater tendency to increase in price (37%). Average price changes per publisher ranged from 0 (no change) to a 34% average increase in price. In some cases, price increases and decreases cancel each other out resulting in an average of 0 (no change) masking considerable change at the per-journal level. Only 2 publishers have APPCs; these have similar average prices. Average APC price by publisher ranges from 246 to 2,851 USD. UK-based not-for-profit publisher Ubiquity Press stands out as having the second-lowest average APC of 536 USD with no price increases.

Context

As reported by Singh & Morrison (2019), the global average APC has shown little change between 2010 and 2019, but variation in the mode and a constant increase in maximum APC and APPC, along with case studies by the SKC team, suggests that this does not give the whole picture of what is happening. The purpose of this study is to investigate whether change in APC or APPC is more obvious at the per-journal or per-publisher level.

Research question

Are there observable changes in APC or APPC at the per-journal or per-publisher level from 2018 – 2019?

Method

The data for this study is from the 2019 iteration of the APC longitudinal study; for documentation of the main study, a link to the dataset, and an invitation to open peer review, see Morrison et al. (2019). As reported by Singh & Morrison (2019), the majority of journals do not charge publication fees. Journals from the main spreadsheet were selected for which an APC or APPC amount is available for both 2018 and 2019. This resulted in a sample of 2,471 journals. Currencies were matched and original currency used for calculations wherever the same currency was listed in both years (2,255 APC journals). The reason for matching currency is to avoid conflation of currency fluctuations and pricing changes. For the remaining journals, APC in USD equivalent was done, using June 30, 2019 XE Currency Converter rates. The 2018 price was deducted from the 2019 price and the difference was divided into the 2018 price to determine the percentage of change.

A second sub-selection was drawn from this sample, limiting to journals that were listed in DOAJ on January 31, 2019, resulting in a sample of 1,514 journals. Of these, 1,394 match in currency in 2018 and 2019. Calculation of the numeric and percentage difference in price from 2018 to 2019 was calculated as described above. This eliminates journals by publishers that are no longer listed in DOAJ, newer journals that are not yet listed in DOAJ and other journals that are listed due to not meeting one of the DOAJ criteria, such as minimum number of articles published per year.

Per-publisher analysis was conducted using the second (DOAJ journals only) sample. For each publisher with more than one journal in the sample, the average APC or APPC was calculated as well as the average, minimum and maximum percentage change.

Results

Journals with APC or APPC data in both 2018 and 2019

As illustrated in the table and chart below, pricing trends on a per-journal basis varied. The majority of journals (62%) did not change in price; 13% decreased in price and 25% increased in price.

2018 – 2019 APC or APPC price changes
# journals % journals
Price decrease 317 13%
No change in price 1,528 62%
Price increase 626 25%
Grand Total 2,471

Journals in DOAJ 2019 with APC or APPC data in both 2018 and 2019

The following table and chart illustrate a somewhat different trend when limiting to journals included in DOAJ. The percentage of journals with price decreases is the same at 13%, but the percentage of journals with price increases in higher at 37%. Half the journals (50%) did not change in price.

2018 – 2019 APC or APPC price changes, DOAJ journals only
# journals % journals
Price decrease 191 13%
No change 758 50%
Price increase 565 37%
Grand Total 1,514

Price change 2018 – 2019 by publisher

The following illustrates that pricing changes from 2018 – 2019 varied by publisher. 6 publishers had no price changes from 2018 – 2019. 16 publishers did have price changes from 2018 – 2019. For the publishers with price changes, there were differences in the pattern of change. Nature and Sage’s price increases and price decreases cancel each other out for an average of no change in price. A few publishers either kept prices the same or increased them, however most publishers have a mixture of price increases and decreases. In interpreting the pricing trends, it is important to consider the average price. A publisher with no price increases may have a higher average APC than a publisher with price increases. The average prices will be highlighting in the next table.


Publisher Average APC 2019 * Currency APC or APPC in USD ****  Average price change % 2018 – 2019 Min. price change 2018 – 2019 *** Max. price change 2018 – 2019
Publishers with no price changes 2018 – 2019
APC Average APC 2019 *
American Geophysical Union (AGU) 1,800 USD 1,800 0%
De Gruyter 1,045 EUR 1,188 0%
Karger Publishers 2,783 CHF 2,851 0%
Public Library of Science (PLoS) 2,428 USD 2,428 0%
Ubiquity Press** 536 USD 536 0%
APPC (per-age not per-article) Average APPC 2019 *
Copernicus Publications (APPC) per-page not per-article 64 EUR 73 0%
Publishers with price changes 2018 – 2019
APC Average APC 2019 *
BioMed Central 1,533 GBP 1,947 10% -42% 123%
Dove Medical Press 1,983 USD 1,983 1% 0% 18%
Elsevier ** 1,633 USD 1,633 13% -50% 567%
Frontiers Media S.A. 2,297 USD 2,297 10% 0% 100%
Hindawi Limited 1,161 USD 1,161 6% -24% 95%
MDPI AG 848 CHF 869 23% 0% 227%
Nature Publishing Group 2,031 GBP 2,579 0% -21% 28%
Oxford University Press ** 1,572 USD 1,572 22% -51% 61%
PAGEPress Publications 473 EUR 538 1% 0% 20%
SAGE Publishing ** 1,429 USD 1,429 0% -59% 67%
SpringerOpen 1,205 EUR 1,370 8% -37% 109%
Taylor & Francis Group ** 693 USD 693 6% -56% 500%
Wiley 2,331 USD 2,331 3% -27% 100%
Wolters Kluwer 2,433 USD 2,433 1% 0% 6%
Wolters Kluwer Medknow Publications ** 246 USD 246 34% -57% 602%
APPC (per-page not per-article)
AOSIS (APPC) per-page not per-article 1,196 ZAR 85 5% 0% 19%
* Average prices of journals listed in DOAJ in Jan 2019 and for which APC data is available for both 2018 and 2019.
** Prices converted to USD June 30, 2019 as APCs listed in different currencies.
*** Negative numbers reflect price decreases
**** Based on June 30, 2019 currency conversion rate, XE currency

The following table shows the average APC in USD by publisher in ascending order (starting with the lowest price), along with average, minimum and maximum price changes from 2018 – 2019 by percentage.

Publisher 2019 Average APC or APPC in USD Average price change 2018 – 2019 % Min. price change 2018 – 2019 *** Max. price change 2018 – 2019
APC
Wolters Kluwer Medknow Publications ** 246 34% -57% 602%
Ubiquity Press** 536 0%
PAGEPress Publications 538 1% 0% 20%
Taylor & Francis Group ** 693 6% -56% 500%
MDPI AG 869 23% 0% 227%
Hindawi Limited 1,161 6% -24% 95%
De Gruyter 1,188 0%
SpringerOpen 1,370 8% -37% 109%
SAGE Publishing ** 1,429 0% -59% 67%
Oxford University Press ** 1,572 22% -51% 61%
Elsevier ** 1,633 13% -50% 567%
American Geophysical Union (AGU) 1,800 0%
BioMed Central 1,947 10% -42% 123%
Dove Medical Press 1,983 1% 0% 18%
Frontiers Media S.A. 2,297 10% 0% 100%
Wiley 2,331 3% -27% 100%
Public Library of Science (PLoS) 2,428 0%
Wolters Kluwer 2,433 1% 0% 6%
Nature Publishing Group 2,579 0% -21% 28%
Karger Publishers 2,851 0%
APPC (per-age not per-article)
Copernicus Publications (APPC) per-page not per-article 73 0%
AOSIS (APPC) per-page not per-article 85 5% 0% 19%

Discussion and conclusions

The data clearly demonstrate that the volume and direction of pricing changes varies by journal and by publisher. From 2018 to 2019, most journals did not change in price, some decreased in price, and others increased in price. Different APC based publishers display different tendencies and a wide range of average APCs, from 246 to 2,851 USD. The two APPC based publishers had similar pricing. The lowest average APC of 246 USD was for Wolters Kluwer Medknow. As noted by Avashti & Morrison (2019), most Medknow journals do not charge APCs; the average APC is likely impacted by the area served, as Medknow originated in India. It is not surprising that the 3 highest average APCs are associated with European based publishers (Wolters Kluwer, Nature, and Karger). However, the low average APC of UK based Ubiquity Publishing at 536 USD, combined with no price increases, is in marked contrast with Oxford University Press’ average APC of 1,572 USD and average price increase of 22%. This evidence of differences in APC / APPC and pricing trends by publisher supports, and is supported by, Shi & Morrison’s (2019) comparison of 4 pairs of publishers and sub-publishers.

References

Avasthi, N & Morrison, H (2019). Medknow 2019 – is this the best for India? Sustaining the Knowledge commons. https://sustainingknowledgecommons.org/2019/11/23/medknow-2019-is-this-the-best-for-india/

Morrison, H. et al. (2019). OA Main 2019: Dataset, documentation and open peer review invitation. Sustaining the knowledge commons. https://sustainingknowledgecommons.org/2019/11/20/oa-main-2019-dataset-documentation-and-open-peer-review-invitation/

Shi, A & Morrison, H. (2019). APCs comparisons among different publishers in 2019. Sustaining the knowledge Commons. https://sustainingknowledgecommons.org/2019/11/26/apcs-comparisons-among-different-publishers-in-2019/

Singh, S. & Morrison, H. (2019). OA journals non-charging and charging central trends 2010 – 2019. Sustaining the knowledge commons. https://sustainingknowledgecommons.org/2019/11/23/oa-journals-non-charging-and-charging-central-trends-2010-2019/

Cite as:  Morrison, H. (2019). APC price changes 2019 – 2018 by journal and by publisher. Sustaining the knowledge commons. https://sustainingknowledgecommons.org/2019/11/26/apc-price-changes-2019-2018-by-journal-and-by-publisher/


Open Access in 2019: Which countries are the biggest publishers of OA journals?

by Hamid Pashaei and Heather Morrison

Fifty percent of the open access (OA) journals listed in DOAJ in 2019 are published in Europe, and the United Kingdom is the biggest publisher of OA journals in DOAJ. It is important to note that we do not know the extent to which OA journals are fully represented in DOAJ; we understand that there is a parallel service called Chinese Open Access Journals. There are a few surprises in the 10 largest countries in DOAJ. Latin America and the U.S. are well represented as usual, while Indonesia is now the second largest country in DOAJ, and Poland, Iran, and Turkey, are among the top 10. This may reflect the work of the DOAJ ambassadors program.

The analysis of geographical data on Directory of Open Access Journals (DOAJ) shows that the European countries are leading the way in publication of Open Access journals by publishing 6133 journals in 2019, while Oceania and Africa published the least amount of OA journals in the same period.

The United Kingdom is the biggest publisher of open access journals by publishing 1471 journals in 2019. Indonesia and Iran are among the top 10 publishers of OA journals in 2019 that implies a growing interest in open access in these two countries.

Our team of researches collected the publication fee data for the open access journals in 2019 to see how the pricing to publish OA journals differs in different parts of the world. The results shows that while 71% of OA journals published in North American countries do not charge article processing charge (APC), but the average APC for the rest of the journals in North America is 1473 USD which is more expensive than any other part of the world. Asia with the average APC of 190 USD is the least expensive continent to publish OA journals.

Crawford (2019) published the results of his research on world open access journals in 2018 but he categorized the regions in a different way.

The following table shows the share of world OA journals in 2019 by each continent. It should be noted that the true number of OA journals in the world are higher, but here we are only analyzing the journals which geographical data on DOAJ was available.

The following table shows the percentage of journals which charge APC comparing those which do not charge APC in each continent. Because the information regarding APC was not available for some journals, the sum of APC and NO APC columns in the table for some rows is not equal to 100 percent.

Of the journals that charge APC, the average APC amount for each region is shown in the following table. The high standard deviation implies high variability in the range of prices.

According to the DOAJ data, there are 24 countries that have published more than 100 OA journals in 2019.

The summary of top 24 countries in publishing open access journals is shown below.

The method and documentation of the current research by Morrison et al. (2019) and the complete dataset is listed in the references section.

Cite as: Pashaei, H. & Morrison, H. (2019c). Open Access in 2019: Which countries are the biggest publishers of OA journals? Sustaining the knowledge commons. https://sustainingknowledgecommons.org/2019/11/26/open-access-in-2019-which-countries-are-the-biggest-publishers-of-oa-journals/

References
Morrison, H. et al. (2019). OA Main 2019: Dataset, documentation and open peer review invitation. Sustaining the knowledge commons. https://sustainingknowledgecommons.org/2019/11/20/oa-main-2019-dataset-documentation-and-open-peer-review-invitation/

Morrison, Heather, et al. 2019, “OA APC longitudinal study dataset 2019”,https://doi.org/10.5683/SP2/0DIPGE, Scholars Portal Dataverse, V1

Crawford, W. (2019). Gold Open Access 2013-2018: Articles in Journals (GOA4), Livermore, CA:2019. Retrieved Oct. 31, 2019 from https://waltcrawford.name/goa4.pdf


DOAJ 2019: Language analysis

by Hamid Pashaei and Heather Morrison

The analysis of Directory of Open Access Journals (DOAJ) shows that open access journals were published in 85 different languages in 2019. English is the language used by more than 9,500 journals, while Spanish language comes second with more than 2,400 journals, followed by Portuguese (1,731), Indonesia (1,135) and French (897). We analyzed the tendency to charge and average APC by first language listed. The only language with a majority of journals charging APCs was Chinese (54%), followed by Persian (33%) and English (31%). Average APC ranged from 43 USD (Indonesian) to 1,096 USD (English). The second highest APC was Catalan at 331 USD, illustrating a correlation between language and APC, with English language journals at the high end of the range.

The most popular languages to publish open access articles in 2019 are listed in the following table.

We analyzed the article processing charge (APC) for the ‘first language’ that OA journals publish articles in, and the results for the top languages are shown below.

Cite as: Pashaei, H. & Morrison, H. (2019b). DOAJ 2019: Language analysis. Sustaining the knowledge commonshttps://sustainingknowledgecommons.org/2019/11/26/doaj-2019-language-analysis/

References
Morrison, H. et al. (2019). OA Main 2019: Dataset, documentation and open peer review invitation. Sustaining the knowledge commons. https://sustainingknowledgecommons.org/2019/11/20/oa-main-2019-dataset-documentation-and-open-peer-review-invitation/

Morrison, Heather, et al. 2019, “OA APC longitudinal study dataset 2019”,https://doi.org/10.5683/SP2/0DIPGE, Scholars Portal Dataverse, V1

Directory of Open Access Journals 2010 – Metadata. Retrieved at various dates from https://doaj.org/faq#metadata


Open Access in 2019: Original currencies for article processing charge

by Hamid Pashaei and Heather Morrison

The original currency to charge article processing charge (APC) for more than 50 percent of world open access (OA) journals in 2019 recorded in our study is USD (for documentation of our procedures see Morrison et al (2019), while GBP and EUR are in the second and third place. 5 currencies (USD, GBP, EUR, CHF – Swiss Franc, INR – Indian Rupee) account for over 90% of the journals.

The following table and chart depict the original currency for OA journals in 2019.

When looking at the average APC in each original currency, it could be seen that the journals that their original currency is GBP charge the highest amount of APC. The top 10 most expensive APCs in original currency are listed below (all amount are converted to the USD).

Cite as: Pashaei, H. & Morrison, H. (2019a). Open Access in 2019: Original currencies for article processing charge. Sustaining the knowledge commons. https://sustainingknowledgecommons.org/2019/11/26/open-access-in-2019-original-currencies-for-article-processing-charge/

References
Morrison, H. et al. (2019). OA Main 2019: Dataset, documentation and open peer review invitation. Sustaining the knowledge commons. https://sustainingknowledgecommons.org/2019/11/20/oa-main-2019-dataset-documentation-and-open-peer-review-invitation/

Morrison, Heather, et al. 2019, “OA APC longitudinal study dataset 2019”,https://doi.org/10.5683/SP2/0DIPGE, Scholars Portal Dataverse, V1

Directory of Open Access Journals 2010 – Metadata. Retrieved at various dates from https://doaj.org/faq#metadata

APCs comparisons among different publishers in 2019

Abstract

This post features 4 comparisons between publishers and sub-publishers of fully open access journals that are included in our longitudinal APC study. Traditional publisher Wolters Kluwer owns two sub-publishers (or imprints). Wolters Kluwer Medknow journals tend not to charge APCs, and have low prices when they do charge. Wolters Kluwer Lippincott journals tend to charge, and prices are high. Indonesian-based Universitas Negeri Semerang is now one of the world’s largest OA journal publishers by the number of journals and appears to be new to online publishing using open-source software. Very few of their journals have APCs. The traditional Oxford University Press tends to have APCs, and their APCs are more than twice as high as a new UK-based not-for-profit OA journal publisher, Ubiquity Press. MDPI and Hindawi are very similar, both are fairly new, APC based commercial OA journal publishers; but Hindawi’s average APC is 44% higher than MDPIs. To understand the economics of OA journal publishing, it is necessary to take into account the strategies of particular publishers and even sub-publishers.

Research Question: are publishers and sub-publishers of fully open access journals pursuing observably different strategies with respect to publication fees (charging / non-charging, pricing strategies).

Method: 4 pairs of publishers or sub-publishers (imprints) were selected for comparison using the data from OA Main 2019, based on what appear to be differences in approach by publishers that are otherwise similar: Wolters Kluwer’s Medknow (India-based, OA in origin) & Lippincott (U.S. based, traditional subscriptions in origin); university-based publishers Universitas Negeri Semarang (Indonesia) & University of Oxford (U.K.); University of Oxford & Ubiquity (both U.K. based, traditional subscriptions v. OA origin) and MDPI & Hindawi (both commercial, OA in origin based on the APC model). Status of fully OA journals published by each publisher was compared, focusing on the tendency to charge (or not) and the amount of APC for charging journals.

Detail

1.Wolters Kluwer Medknow & Lippincott

Wolters Kluwer is one of the world’s oldest commercial scholarly publishers, having been established in 1836 in the Netherlands, where the company’s global headquarters is still located (Wolters Kluwer,2019a).

After acquiring Medknow in 2011, Wolters Kluwer focuses on develop strategic partnerships and leverage global brand and strengthen go-to-market (Wolters Kluwer,2019a). However, in Wolter Kluwer 2019 half-year financial report says: “Recurring revenues accounted for 80% of total revenues and grew 5% organically (HY 2018: 5%). Recurring revenues include subscriptions and other renewing revenue streams”. In the report, they also publish their major revenue (85.5%) comes from digital and service subscription and open access APC does not show as a certain type of revenues below (Wolters Kluwer,2019b).

Chart 1. Wolters Kluwer 2019 Half-Year financial Report

Medknow & Lippincott are different sub-publishers (imprints) belonging to Wolters Kluwer.

In 2019, Wolters Kluwers Medknow publishes 527 journals among which 99 journals (18.8%) have an APC, over half of journals do not charge a publication fee (66.6%). It is also important to notice that a few journals are redirecting to risky URL which is concerning as there are chances, it has been stolen by some other company (Avasthi, N & Morrison, H, 2019). Among the 99 journals with an APC that were studied, the highest APC is 1,500 USD and the minimal price is 9 USD. The average APC is 200 USD per article and, the most common publication fee (mode) is 150 USD per article.

2019 APC Wolters Kluwers Medknow website

For Wolters Kluwers Lippincott’s fully OA journals, over two-thirds of its journals (71.9%) have a publication fee. Among the 23 journals, the average APC is 1,756 USD per article, the range of APC (article proceeding cost) starts from 1,000 USD to 2,250 USD, and most common APC (mode) is 1,500 USD per article.
Compare to Medknow, Lippincott has a much higher average APC. Lippincott’s average publication fee is almost 9 times the average of Medknow which is 200 USD. A lower standard deviation of Medknow indicates that the publication fees tend to be close to the mean (200 USD) of the set, while a high standard deviation of Lippincott indicates that the publication fees are spread out over a wider range.

2019 APC Wolters Kluwers Lippincott website

2. Universitas Negeri Semarang & University of Oxford

Oxford University Press is one of the oldest scholarly publishers officially established in 1668. From the late 1800s, Oxford University Press began to expand significantly and makes most of its revenue from subscription and book sales.

Universitas Negeri Semarang , it appears to be fairly new to online publishing; in DOAJ the first year of online publication is 2009 or later for all the journals (column IO). Most of the journals appear to be published in Indonesian and/or English. The platform used is OJS – open source journal publishing software developed by the Public Knowledge Project. In other words, we have contrasted a very old, traditional, UK-based publisher with a new approach. (Note the size of OA journal publishing by UNS – see Appendix A.)

Universitas Negeri Semarang, based in Indonesia, is among the largest fully open access publishers with 96 journals. According to DOAJ webpage, Indonesia becomes the second largest country of publisher by number of journals ( see Appendix B.) and Indonesian rupiah becomes the 6th among all the original currencies for OA journals which accounts for 1.86%. The University of Oxford is a very well-known traditional scholarly publisher. These two university publishers have different approaches to APC. After comparing these two publishers we found Universitas Negeri Semarang has no publication fee for 88.5% of its journals while the University of Oxford has a fee for 80.3% of its fully open access journals.

3. University of Oxford and Ubiquity

As mentioned before, Oxford University Press is one of the oldest scholarly publishers which has a rich history which can be traced back to the earliest days of printing.

Ubiquity Press as an open access publisher of peer-reviewed academic journals and books was founded by researchers at University College London (UCL) in 2012. As a highly cost-efficient press, it provides access to the platform to give universities and societies the infrastructure and services they need to run their own presses through the Ubiquity Partner Network and allow societies to earn income from open access.

The average price of Ubiquity journals that only charge in GBP is 469 GBP (596 USD) and the most common price among those journals (mode) is 300 GBP (381 USD). The average price of Oxford University Press journals that only charge in GBP is 4543 GBP (5769 USD) and the most common price among those journals (mode) is 1250 GBP (1587 USD). The chart below shows the differences between Ubiquity and Oxford University Press on the APC that charged in GBP.

The overall average APC of Ubiquity journals that have a fee is 577 USD while the overall average APC of the University of Oxford is 1,549 USD. The average APC difference between these two publishers is 972 USD.

2019 APC Ubiquity publisher website

4.MDPI and Hindawi

Hindawi is one of the world’s largest publishers of peer-reviewed, fully Open Access journals. Built on an ethos of openness, it works with the global academic community to promote open scholarly research to the world. Based in institutions around the globe, it focuses on serving authors while preserving robust publishing standards and editorial integrity.

MDPI has supported academic communities since 1996 as a non-profit institute for the promotion and preservation of the diversity of chemical compounds. Based in Basel, Switzerland, MDPI has the mission to foster open scientific exchange in all forms, across all disciplines.
Mr. Dietrich Rordorf joined MDPI as Dr. Shu-Kun Lin’s assistant in August 2005. As an experiment, a modified version of the online submission and editorial system based on the Open Journals System (http://pkp.sfu.ca/ojs/) was launched by Dietrich for IJMS. Nowadays, MDPI has become the 7th largest publisher in number of articles published in 2018, and the largest publisher of open access articles in DOAJ in 2018.

MDPI and Hindawi charge fees for all the journals they published in 2019. However, their publication fees are different as the charts show below. Even though the highest APC are quite close for both publisher (2,049 USD for MDPI and 2,300 USD for Hindawi), the average APC for MDPI is 822 USD and 1,186 USD for Hindawi. We can also see the difference through mode. The most common price of Hindawi is 950 USD per article (Shi, A., 2019) while the most most common APC for MDPI journals is 350 CHF (359 USD) in 2019.

Cite as: Shi, A & Morrison, H. (2019). APCs comparisons among different publishers in 2019. Sustaining the knowledge https://sustainingknowledgecommons.org/2019/11/26/apcs-comparisons-among-different-publishers-in-2019/

Reference:

Morrison, H. (2018). MDPI 2019: price increases, some hefty, and more coming in July. Sustaining the knowledge https://sustainingknowledgecommons.org/2019/02/13/mdpi-2019-price-increases-some-hefty-and-more-coming-in-july/
Avasthi, N & Morrison, H. (2019). Medknow 2019 – is this the best for India? Sustaining the Knowledge commons. https://sustainingknowledgecommons.org/2019/11/23/medknow-2019-is-this-the-best-for-india/
Shi, A. (2019). Hindawi APC comparison 2018-2019. Sustaining the knowledge https://sustainingknowledgecommons.org/2019/11/05/hindawi-apc-comparison-2018-2019/
Brutus, W. (2015). Oxford Open: Increased the Number of Open Access Journal. Sustaining the knowledge https://sustainingknowledgecommons.org/2016/11/17/oxford-open-increased-the-number-of-open-access-journal/
Pasha, H. (2019). Open Access in 2019: Original currencies for article processing charge. Sustaining the knowledge https://sustainingknowledgecommons.org/2019/11/26/open-access-in-2019-original-currencies-for-article-processing-charge/
Pasha, H. (2018). Medknow in 2018: growing fast! Sustaining the knowledge https://sustainingknowledgecommons.org/2018/12/13/medknow-in-2018-growing-fast/
Hindawi (2019). About Hindawi. Retrieved Nov. 19, 2019 from https://about.hindawi.com/
MDPI (2019). Overview. Retrieved Nov. 19, 2019 from https://www.mdpi.com/about
Wolters Kluwer (2019)a. Our heritage. Retrieved Nov. 19, 2019 from https://wolterskluwer.com/company/about-us/our-heritage
Wolters Kluwer (2019)b. Wolters Kluwer 2019 Half-Year Report. Retrieved Nov. 19, 2019 from https://wolterskluwer.com/binaries/content/assets/wk/pdf/investors/press-releases/2019.07.31-wolters-kluwer-2019-half-year-report.pdf
Ubiquity Press (2019). About Ubiquity Press. Retrieved Nov. 19, 2019 from https://www.ubiquitypress.com/site/about-general/

Appendix A

Publishers in DOAJ in descending order of number of journals

As of Nov. 19, 2019, Universitas Negeri Semarang is the 12th largest publisher by number of journals listed in the Directory of Open Access Journals (DOAJ)

Elsevier (339)
BMC (328)
Sciendo (326)
Hindawi Limited (238)
SpringerOpen (202)
Wolters Kluwer Medknow Publications (194)
MDPI AG (191)
SAGE Publishing (165)
Taylor & Francis Group (163)
Wiley (109)
Dove Medical Press (103)
Universitas Negeri Semarang (90)

Appendix B

Country of publisher in DOAJ in descending order of number of journals

As of Nov. 21, 2019, Indonesia becomes the second largest country of publisher by number of journals listed in the Directory of Open Access Journals (DOAJ)

United Kingdom (1,609)
Indonesia (1,565)
Brazil (1,445)
Spain (755)
United States (741)
Poland (619)
Iran, Islamic Republic of (511)
Turkey (404)
Italy (387)
Russian Federation (367)

Medknow 2019 – is this the best for India?

By: Niharika Avasthi and Heather Morrison

Abstract – Open access journals have been developing in India for several decades for promoting the visibility of research done in various streams. OA to science has been encouraged by government sponsored repositories of student and doctoral proposals, and numerous Indian journals are distributed with OA. There is a need to build mindfulness among Indian scholastics with respect to publication practices, including OA, and its potential advantages, and use this methodology of distribution at whatever point doable, as in openly supported research. This research also showed that a well doing publisher in India gets acquired by  European publisher Wolters Kluwer and becomes commercialised. The number of journals with “title not found” or “risky URL”, for example leading to a scam website, is surprising as one might assume that the motivation for this publisher’s society, university and commercial partners is that such partnership would result in high quality services. Most Medknow journals do not charge publication fees. The journals with publication fees are increasing the cost up to 50%. For documentation and a link to the underlying dataset, see Morrison et al. (2019).

According to the Medknow website, Medknow Publications was founded in 1997 in Mumbai, India by Devkumar Sahu. Sahu opted for the open access model of publishing services. Open access publishing means that research outputs and analysis are available online free of cost. In 2006, Medknow had 33 scientific technical and medical journals in its portfolio, at the time, one of the largest open access publishers of medical content in the world. They became the largest open access publishers of medical content till 2006. It was then acquired by Wolters Kluwer in Dec 2011.  Medknow now provides publishing services to over 500 medical society journals in over 40 specialties. These are open access journals. Open access increases the visibility and accessibility of the published content. Medknow publishes journals in partnership with societies (affiliations), universities or other commercial partners for the most part. Most of the publications offer free access to the full text of papers immediately. Authors can self-archive articles that have been published. Journals are available freely online but also available through value-added subscriptions.

Chart 1 : Medknow 2019 count of publisher type
CodeMeaning% of total
C/SCommercial / society (Medknow publishes in partnership with a scholarly society)56%
C/UCommercial / university (Medknow publishers in partnership with a university)25%
No PartnershipOwned outright by Medknow10%
C/CCommercial / Commercial (Medknow publishes in partnership with another commercial publisher9%

531 Medknow journals were analysed in this research. This is an increase of approximately 7% in the count of journals in 2018. It is a significant growth however lesser as compared to that from 2017-2018. Out of these 531 journals, almost 65% of the journals do not charge publication cost. It is also important to notice that a few journals are redirecting to risky URL which is concerning as there are chances, it has been stolen by some other company. For the analysis I looked at each journal from Medknow’s website on an alphabetical basis. The charges for each journal are mentioned in a different manner. Some of the journals directly states the cost they charge however; few charges are based of the article type as mentioned below:

  • Short communications
  • Case Reports
  • Original Articles
  • Qualitative Research
  • Review Articles
  • Number of words

The below graph shows the representation of charges being taken by Medknow for 2019.

Out of 104 journals that are charging APC, below table shows the distribution of charges based on different currencies for the year 2019.

Most journals are charging in INR and USD. It is to be noticed as the journal originally started from India, but they started taking the publication cost in various other currencies as well which could be confusing for potential authors. Even for INR, there is no fixed cost and it is varying depending on each journal. There are few journals who are not charging for Indian authors but have mentioned publication costs for writers outside India. Have a look at the chart below:

This is a variation and we cannot suggest on a pattern of the publication cost. Below table shows the numbers currency wise:

If we look at the data from 2018, we can see that there has been both increase and decrease in the publication cost for the journals. There has been an increase of 16% in the journals whose title were not found, and this is subsequent to notice as Medknow being one of the well-known publishers does not have websites for so many journals! These journals have not been listed as ceased or nothing specific has been mentioned related to them. There are just 3% journals who showed a price drop but 4% increased the cost. At one side most journals are not charging publication fees but few of them have relatively increased their cost.

Please refer the below table for APC statistics comparison based on different currencies

Looking at the above table, I feel that it is relatively high cost to take for publishing a journal. In todays world, 8000 – 10000 INR would be a week’s salary of a corporate employee in a non metro city. Again, it depends from author to author, but the charge should be in a cap where its not too high. USD, EGP and IRR seem to be balanced as compared to charges being taken in INR globally.

References:

Morrison, H. et al. (2019). OA Main 2019: Dataset, documentation and open peer review invitation. Sustaining the knowledge commons https://sustainingknowledgecommons.org/2019/11/20/oa-main-2019-dataset-documentation-and-open-peer-review-invitation/

Brutus, W. & Morrison, H. (2016). Medknow 2016: it’s complicated! Sustaining the knowledge commons https://sustainingknowledgecommons.org/2016/10/11/medknow-2016-its-complicated/

Fernandez, L. (2006). Open Access Initiatives in India – an Evaluation. Partnership: The Canadian Journal of Library and Information Practice and Research, 1(1). https://doi.org/10.21083/partnership.v1i1.110

Pasha, H. & Morrison, H (2018). Medknow in 2018: growing fast! | Sustaining the Knowledge Commons https://sustainingknowledgecommons.org/2018/12/13/medknow-in-2018-growing-fast/

Singh, S. & Morrison, H. (2019). OA journals non-charging and charging central trends 2010 – 2019. Sustaining the knowledge commons. https://sustainingknowledgecommons.org/2019/11/23/oa-journals-non-charging-and-charging-central-trends-2010-2019/

Cite as: Avasthi, N & Morrison, H (2019). Medknow 2019 – is this the best for India? Sustaining the Knowledge commons. https://sustainingknowledgecommons.org/2019/11/23/medknow-2019-is-this-the-best-for-india/

OA journals non-charging and charging central trends 2010 – 2019

by: Snehita Singh and Heather Morrison

This article summarizes qualitative analysis of APC (Articles Processing Charges) in 2019 and comparison of the central tendencies for APC and APPC (Article page processing charges) of the year 2010 and 2014-2019.

Dataset: Morrison, Heather, et al. 2019, “OA APC longitudinal study dataset 2019”, https://doi.org/10.5683/SP2/0DIPGE, Scholars Portal Dataverse, V1

OA APC Main 2019 dataset documentation

Morrison, H. et al. (2019). OA Main 2019: Dataset, documentation and open peer review invitation. Sustaining the knowledge commons. https://sustainingknowledgecommons.org/2019/11/20/oa-main-2019-dataset-documentation-and-open-peer-review-invitation/

Abstract

For the year 2019, we analyzed around 16000 journals that were fully open access in DOAJ (or whose publishers were listed in DOAJ) at some point from 2010 – 2019. More than half of these journals (58%) published had no publication charge.30% of the journals have publications fees. The most frequent model is APC (28% of total) followed by APPC (page charges), under 1%. In a few cases the cost was not specified or an unusual model such as charge per word was used. Of all the journals analyzed, the title of 4% of journals were not found and 3% of journals belonged to ceased publication. It was noted that 53 journals (less than 1%) also had hybrid charges (partially open access) in 2019. The global average APC was 908 USD. From 2010 the global average APC has ranged from 906 – 974 USD. The lack of change in the global average contrasts with variation in mode, reflecting change in the market, particularly ongoing entry of large numbers of new journals, gradually increasing maximum amounts for both APC and APPC, and substantial changes we sometimes observe when recording data for particular publishers. We conclude that continuing to calculate the global average is a less fruitful method of studying the transition to open access and plan to continue this longitudinal study by using the historical data gathered to focus on case studies.

Moreover, the highest value for APC in 2019 went up to 5800 USD whereas the lowest value remained at 0 USD. The SKC team distinguishes between journals that indicate an intention not to charge (no publication fee) and APC-based journals that have not yet begun to charge (identified as APC journals with APC of 0). The mode was noted to be 500 USD.

Abstract

We also analyzed the central tendencies for APC and APPC for over the years of this study. It was observed that there wasn’t much change in the global average of APCs and APPCs from the year 2010 to 2019 and it ranged between 840 to 1090 USD.


The global average of APPC was noted to vary between 50 to 110 USD.


The highest value of APCs observed each year shows a gradual upward trend over the years and the lowest value of APCs has remained between 0 to 8 USD.

For APPC, the highest value shows a steep increase reaching up to 1844 USD in 2019 (for Karger’s, Dementia and Geriatric Cognitive Disorders Extra, 4 times higher than the second highest APPC) when compared to the previous years. The minimum value of APPCs varied between 0 to 5 USD over the years.


It was observed that the mode of APCs between year 2010 and 2019 kept varying from year to year. It was lowest in the year 2014 and 2017 with 0 USD and highest in the year 2016 and 2018 with around 1800 USD.


For APPCs, it reached to a minimum of 30 USD in 2015.Apart from that, it remained between 50 to 90 USD over the years.


Discussion and conclusions

The global average (mean) APC has changed little over the years. In 2010, Solomon & Björk (2012) recorded an average of 906 USD. Our 2014 data yielded an average of 964 USD (Morrison et al., 2015), in 2017, 974 USD (Morrison, 2018), and for 2019 we record an average of 908 USD. This contrasts with variation in mode or most common APC and gradually increasing maximum APC and APPC and the changing prices we observe when studying particular publishers (most often price increases, sometimes a mix of price increases and decreases). For example, Shi (2019) reports a 2019 Hindawi average APC of 1,186 USD, well above the global average and a 14% increase over the 2018 Hindawi APC. As reported by Pashaei and Morrison (2019), DeGruyter is rapidly expanding its collection of open access journal titles, primarily through its new Sciendo imprint. Most of the OA journals of this commercial publisher do not charge publication fees; of those that do, the range of APC prices is much lower for Sciendo than De Gruyter. A focus on the global average APC does not tell the story of what is happening in the transition to open access. We conclude that continuing to calculate a global average APC is less fruitful in understanding OA transition, and for this reason our future research will build on the OA Main dataset for historical context for a series of case studies.


References

Solomon, D. J. and Björk, B. (2012), A study of open access journals using article processing charges. J Am Soc Inf Sci Tec, 63: 1485-1495. doi:10.1002/asi.22673

Crawford, W. (2019). Gold Open Access 2013-2018: Articles in Journals (GOA4), Livermore, CA:2019. Retrieved Oct. 31, 2019 from https://waltcrawford.name/goa4.pdf

Morrison, H.; Salhab, J.; Calvé-Genest, A.; Horava, T. Open Access Article Processing Charges: DOAJ Survey May 2014. (205). Publications 3: 1-16. http://www.mdpi.com/2304-6775/3/1/1

Morrison, H. (2018). Global OA APCs (APC) 2010–2017: Major Trends. Chan, L. & Pierre Mounier. P. , eds. ELPUB 2018, June 2018, Toronto, Canada. <10.4000/proceedings.elpub.2018.16>.  Retrieved July 5, 2018 from https://elpub.episciences.org/4604

Pashaei, H. & Morrison, H. (2019). De Gruyter and Sciendo Open Access journals expanding in 2019. Sustaining the knowledge commons. https://sustainingknowledgecommons.org/2019/10/16/de-gruyter-and-sciendo-open-access-journals-expanding-in-2019/

Shi, A. (2019). Hindawi APC comparison 2018-2019. Sustaining the knowledge commons. https://sustainingknowledgecommons.org/2019/11/05/hindawi-apc-comparison-2018-2019/

Cite as: Singh, S. & Morrison, H. (2019). OA journals non-charging and charging central trends 2010 – 2019. Sustaining the knowledge commons. https://sustainingknowledgecommons.org/2019/11/23/oa-journals-non-charging-and-charging-central-trends-2010-2019/