OA APC longitudinal survey 2019

OA APC longitudinal survey 2019

Summary

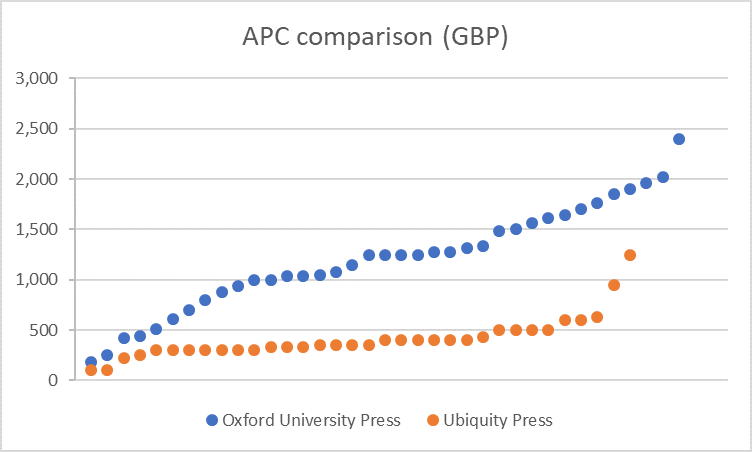
This post presents results of the 2019 OA APC longitudinal survey and extends an invitation to participate in an open peer review process of the underlying data and its documentation. One thing that is not changing is that most OA journals in DOAJ do not charge APCs: 10,210 (73%) of the 14,007 journals in DOAJ as of Nov. 26, 2019 do not have APCs. The global average APC in 2019 is 908 USD. This figure has changed little since 2010, however this consistency masks considerably underlying variation. For example, the average APC in 2019 for the 2010 sample has increased by 50%, a rate three times the inflation rate for this time frame. The tendency to charge or not to charge, how much is charged and whether prices are increasing or decreasing varies considerably by journal, publisher, country of publication, language and currency. One surprise this year was the top 10 countries by number of OA journals in DOAJ. As usual, Europe, the US and Latin America are well represented, but Indonesia is now the second largest country in DOAJ and Poland, Iran, and Turkey are among the top 10, perhaps reflecting the work of the DOAJ ambassadors. Pricing per journal shows mixed trends; most journals did not change price between 2018 and 2019, but there were price decreases as well as increases. The UK’s Ubiquity Press stands out as having a relatively low APC (a fraction of Oxford’s, another UK-based publisher) and no price increases.

Documentation, link to dataset and open peer review invitation

Overview

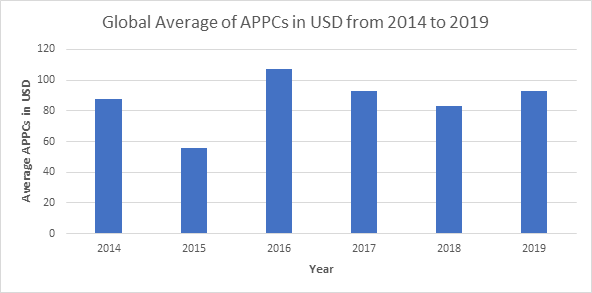
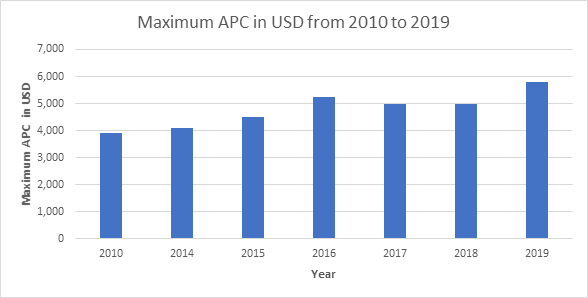
The Sustaining the Knowledge Commons team has been gathering data on OA APCs since 2014 and merging data from DOAJ and other researchers into the main dataset. Singh & Morrison (2019) note that the majority of fully OA journals do not charge; of those that do, the global average APC is 908 USD, a figure that has changed very little since 2010. In contrast, the mode (most common APC) shows quite a bit of variation and the maximum has been increasing for both APC and APPC (article page processing charge). This suggests that there is something else going on.

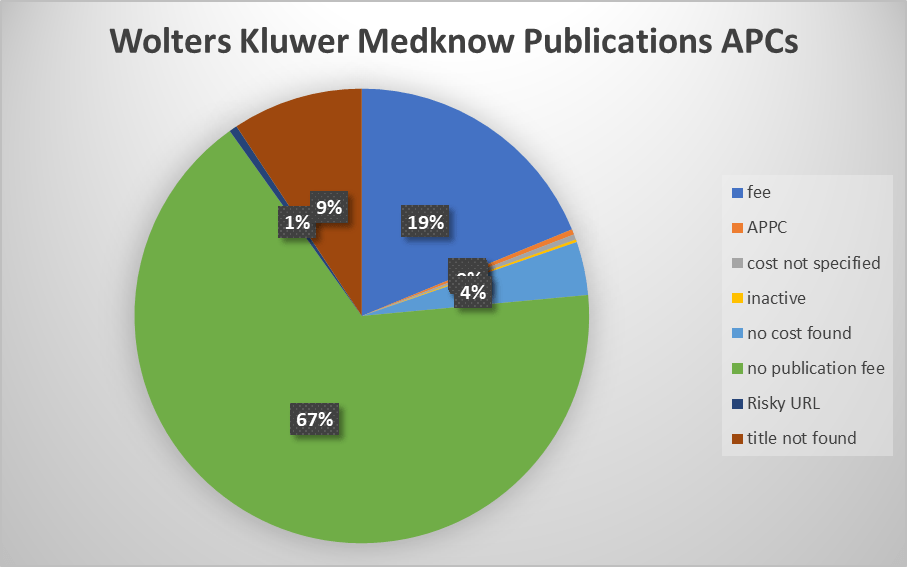
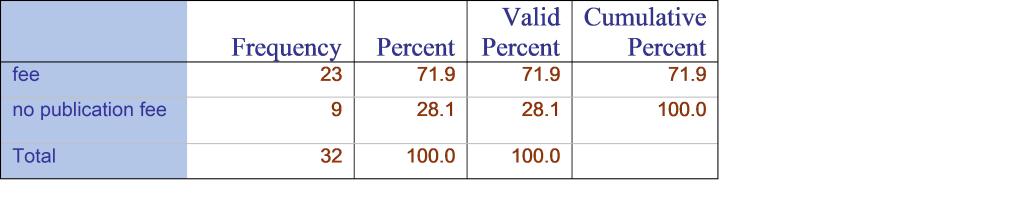
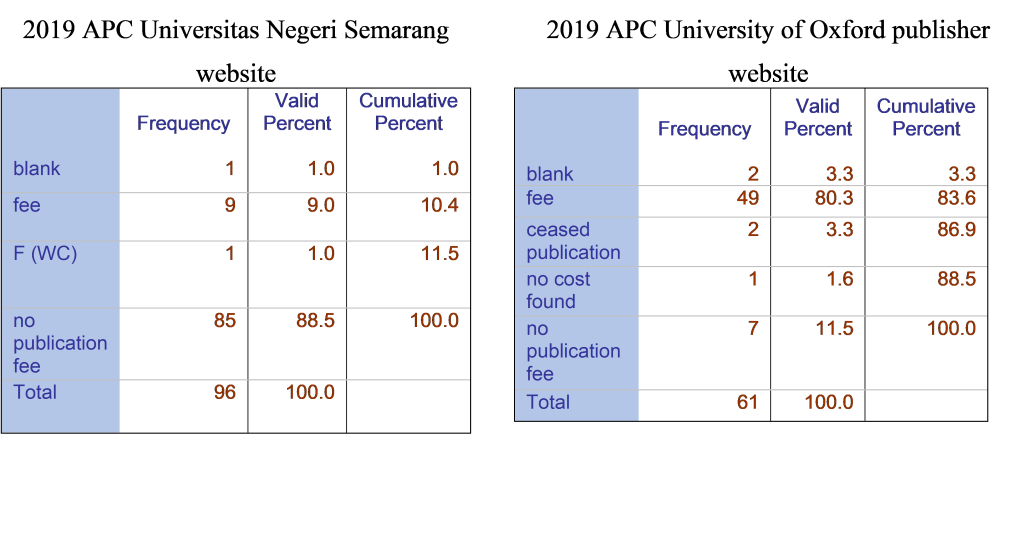
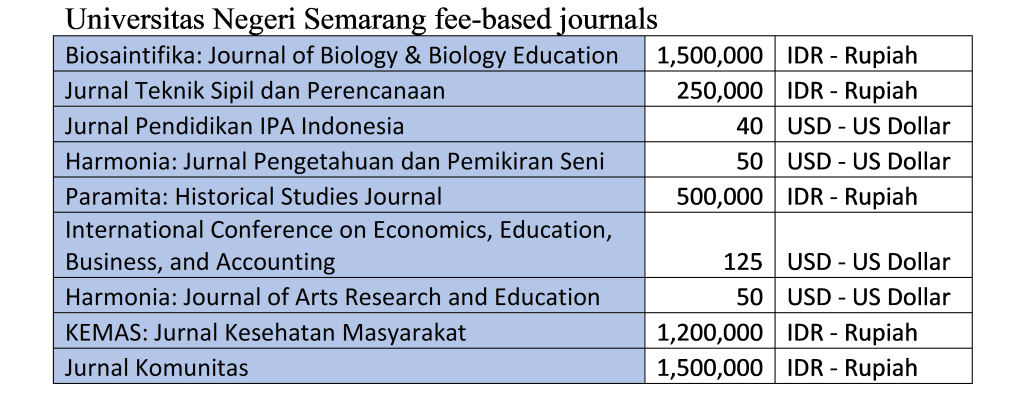
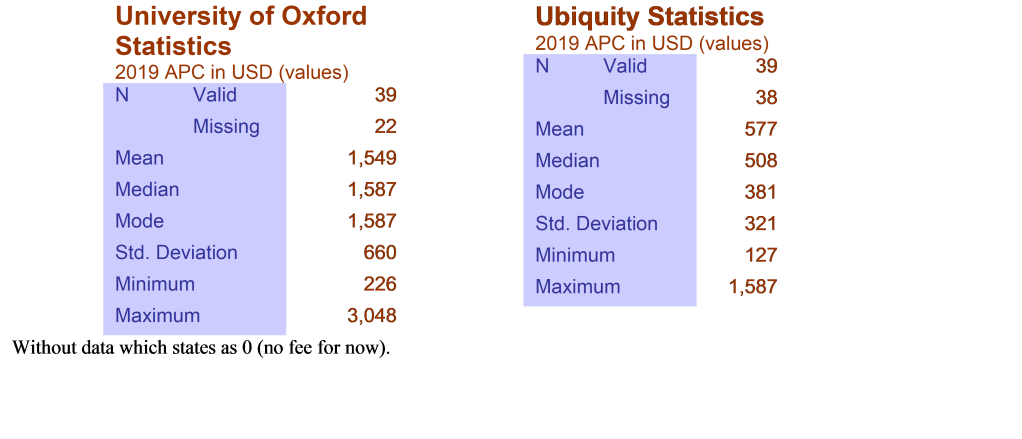
Shi & Morrison’s (2019) findings illustrate that charging trends can vary considerable by publisher. 4 pairs of publishers and sub-publishers are compared. Two Wolters Kluwer imprints, Medknow and Lippincott, are quite different in APCs. Medknow journals tend not to charge, and those that have APCs tend to have relatively low APCs. Lippincott journals tend to charge, at above-average rates. Two universities, Indonesia’s Universitas Negeri Semerang (UNS) (now one of the largest publishers in DOAJ) and Oxford are compared. Oxford is one of the world’s oldest publishers, is UK based, and tends to charge APCs at above-average rates. UNS appears to be a newcomer to online publishing, uses the open source Open Journal System; UNS journals tend not to charge, and when they do charge, prices are relatively low. Oxford was also compared with another UK-based publisher, Ubiquity Press. Ubiquity Press is a new not-for-profit designed to produce OA works and also to achieve cost efficiency. It appears that Ubiquity is having success with the latter, as their average APC is a fraction of that of Oxford. MDPI and Hindawi are compared; both are new commercial APC-based publishers, but the average APC is much higher for Hindawi than for MDPI. This evidence supports the hypothesis that the global average APC masks considerable variation based on publisher history and strategy.

Avasthi & Morrison (2019) explore one of these publishers, Medknow, in more depth, and ask whether this approach is the best for India, the original home of the publisher before acquisition by Wolters Kluwer. It appears that the reason most Medknow journals do not have publication charges is because of numerous partnerships between Wolters Kluwer and scholarly societies and universities. Medknow has expanded beyond India, and has grown quite a bit in both 2018 and 2019. The number of “title not found” and a couple of “risky URL” (a code for when the URL on the publisher’s website leads to a website that is clearly not a journal and gives the appearance of a possible scam) raises some questions about whether the quality of service these journals receive are what they expect and deserve through a partnership with one of the world’s oldest EU-based commercial scholarly publishers.

Pashaei & Morrison (2019a) compare APCs by original currency. Over half of APC charging journals have USD as original currency, and 5 currencies account for more than 90% of APCs. Average prices by currency are translated into USD, and these prices vary quite a bit. APCs in GBP and more than twice as high as APCs in EUR.

Pashaei & Morrison (2019b) compare APCs (pricing and tendency to charge) by language. The tendency to charge varies quite a bit by language (first language listed in DOAJ). For example, 98% of journals in Spanish, Portuguese, French, and Czech do not have publication fees, while about a third of journals in English or Persian have APCs. The average APC for English-language journals is more than 3 times the second highest language-basis APC (Catalan).

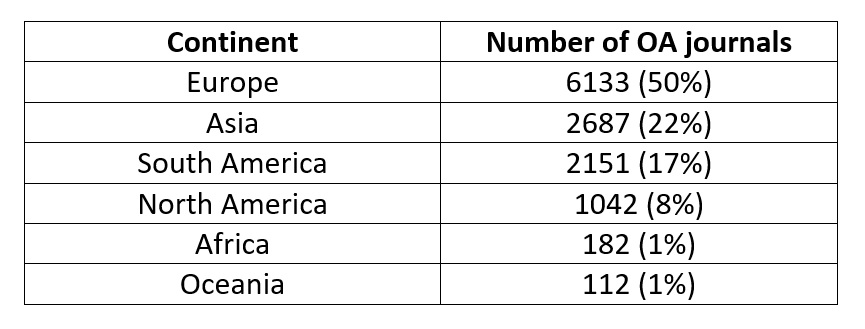
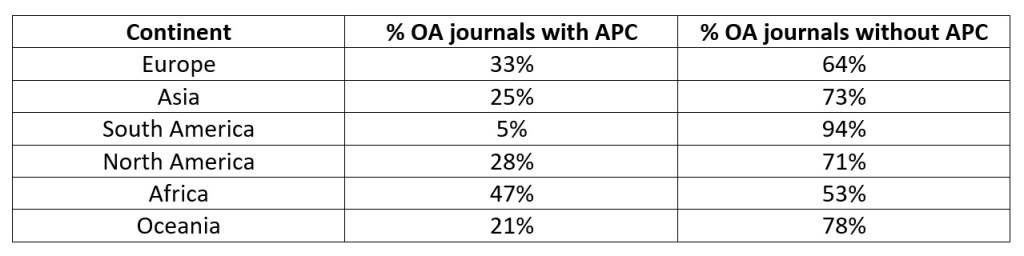
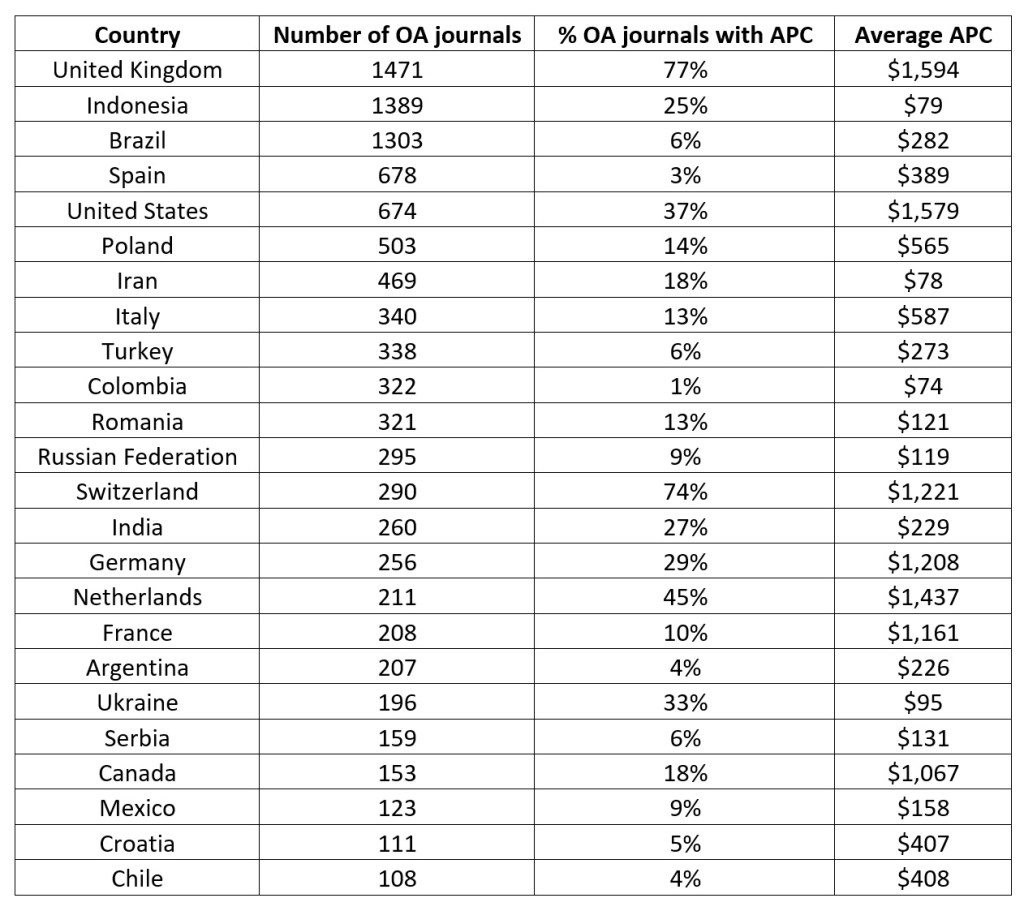
Pashaei & Morrison (2019c) studied the correlation of country in DOAJ, OA journal publishing, and APC. As expected, Europe, the US, and Latin America are well represented in DOAJ. There were some surprises. Indonesia is now the second largest country in DOAJ, and Poland, Iran, and Turkey, are among the top 10. This may reflect the work of the DOAJ ambassadors’ program. Tendency to charge and average APC both vary quite a bit depending on the publisher in question.

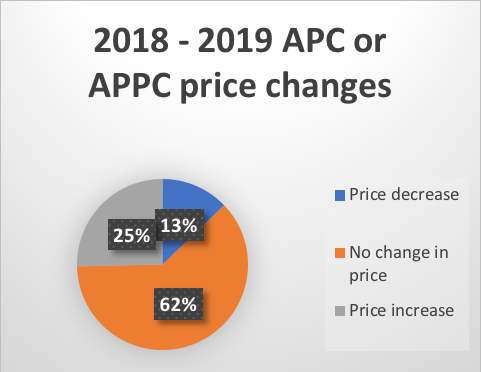
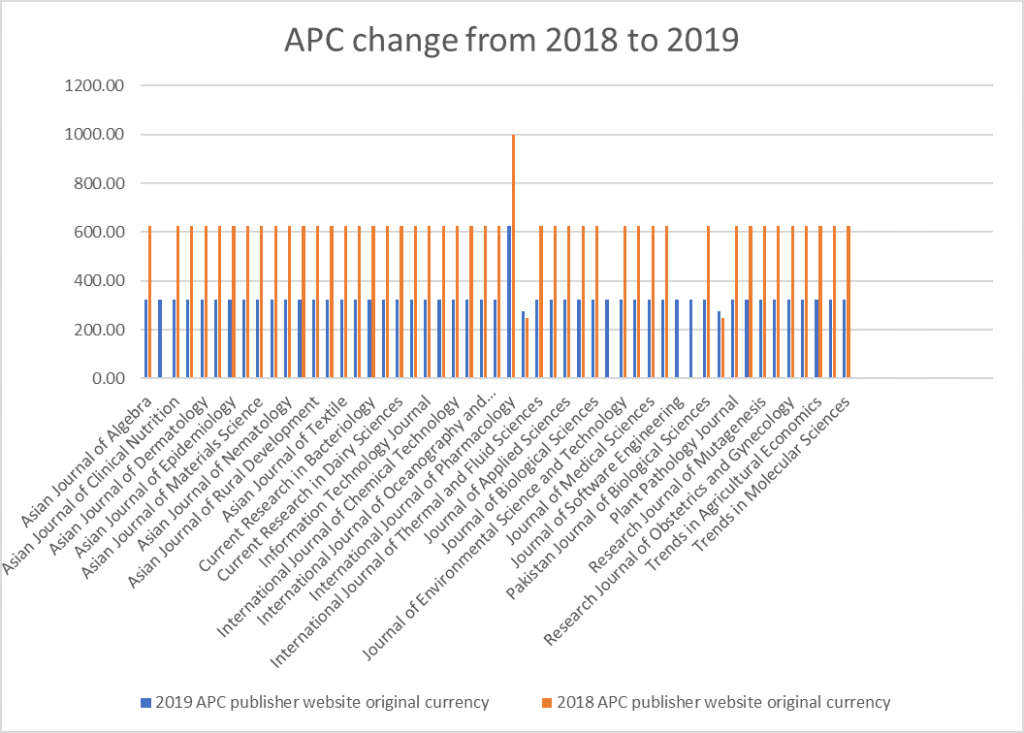
Morrison (2019a) studied charging trends for journals with APC amounts for both 2018 and 2019 and found considerable variation. Most of these journals did not change in APC, but many decreased prices and many more increased prices. The tendency to increase prices was more marked for journals listed in DOAJ as of Jan. 31, 2019. An analysis of trends and average APCs for publisher with 2 or more journals in this set revealed very different patterns. A few publishers did not increase prices. Ubiquity Press stands out as having a relatively low price and no price increase. For some publishers, tendency to decrease and increase prices cancel each other out. 6 publishers had average price increases of more than 10%: Wolters Kluwer Medknow, MDPI, Oxford, Elsevier, BioMedCentral, and Frontiers.

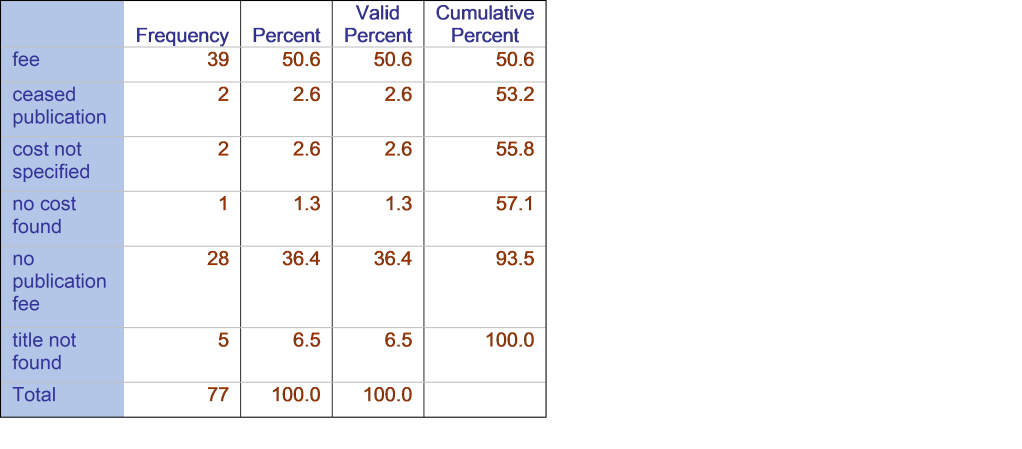
Morrison (2019b) studied status and charging trends for journals included in Solomon & Björk’s (2012) 2010 study, limited to a sample of journals listed in DOAJ and charging APCs at that time. The majority of these journals are still active and charging. The average APC has increased in this time frame by 50%, more than 3 times the inflation. Not all journals have increased in price; some decreased and others remained the same price. Nearly a quarter of these journals have ceased or are not found. Most of this attrition appears to be due to new OA APC-based commercial publishers with a start-up strategy of publishing a wide range of journals, then retiring unsuccessful journals.

Kakou (2019) analyzes African based Sabinet using an approach inspired by The Charleston Advisor’s review series. Brief highlights: Sabinet’s mission is to promote access to information on African research. In this sense, the platform fills its objectives perfectly. It disseminates 500 journals of which 164 are open access, 336 subscription-based with pay-per-view. Most of the journals are from South Africa. Sabinet offers a number of services, including library management services.

Full documentation, link to open dataset, and invitation to participate in open peer review

Morrison, H. et al. (2019). OA Main 2019: Dataset, documentation and open peer review invitation. Sustaining the knowledge commons. https://sustainingknowledgecommons.org/2019/11/20/oa-main-2019-dataset-documentation-and-open-peer-review-invitation/

Dataset: Morrison, Heather, et al. 2019, “OA APC longitudinal study dataset 2019”, https://doi.org/10.5683/SP2/0DIPGE, Scholars Portal Dataverse, V1

Cite as: Morrison, H. et al. (2019). OA APC longitudinal survey 2019. Sustaining the Knowledge Commons. https://sustainingknowledgecommons.org/2019/11/27/oa-apc-longitudinal-survey-2019/

References

Avasthi, N & Morrison, H (2019). Medknow 2019 – is this the best for India? Sustaining the Knowledge commons. https://sustainingknowledgecommons.org/2019/11/23/medknow-2019-is-this-the-best-for-india/

Kakou, T.L. (2019). Sabinet – Comprendre le fonctionnement de l’industrie de l’information en Afrique. Soutenir les savoirs communs. https://sustainingknowledgecommons.org/2019/11/27/sabinet-comprendre-le-fonctionnement-de-lindustrie-de-linformation-en-afrique/

Morrison, H. (2019a). APC price changes 2019 – 2018 by journal and by publisher. Sustaining the knowledge commons. https://sustainingknowledgecommons.org/2019/11/26/apc-price-changes-2019-2018-by-journal-and-by-publisher/

Morrison, H. (2019b). 2010 – 2019 APC update. Sustaining the Knowledge Commons. https://sustainingknowledgecommons.org/2019/11/26/2010-2019-apc-update/

Pashaei, H. & Morrison, H. (2019a). Open Access in 2019: Original currencies for article processing charge. Sustaining the knowledge commons. https://sustainingknowledgecommons.org/2019/11/26/open-access-in-2019-original-currencies-for-article-processing-charge/

Pashaei, H. & Morrison, H. (2019b). DOAJ 2019: Language analysis. Sustaining the knowledge commonshttps://sustainingknowledgecommons.org/2019/11/26/doaj-2019-language-analysis/

Pashaei, H. & Morrison, H. (2019c). Open Access in 2019: Which countries are the biggest publishers of OA journals? Sustaining the knowledge commons. https://sustainingknowledgecommons.org/2019/11/26/open-access-in-2019-which-countries-are-the-biggest-publishers-of-oa-journals/

Shi, A & Morrison, H. (2019). APCs comparisons among different publishers in 2019. Sustaining the knowledge https://sustainingknowledgecommons.org/2019/11/26/apcs-comparisons-among-different-publishers-in-2019/

Singh, S. & Morrison, H. (2019). OA journals non-charging and charging central trends 2010 – 2019. Sustaining the knowledge commons. https://sustainingknowledgecommons.org/2019/11/23/oa-journals-non-charging-and-charging-central-trends-2010-2019/

Solomon, D. J. and Björk, B. (2012), A study of open access journals using article processing charges. J Am Soc Inf Sci Tec, 63: 1485-1495. doi:10.1002/asi.22673


2010 – 2019 APC update

by Heather Morrison

Summary

This is an update of the 2010 study of Solomon & Björk (2012) of a sample of 1,046 journals charging APCs listed in DOAJ at that time. 74% of these journals are still active and actively charging publication fees. The average APC reported by Solomon & Björk was 906 USD; the average in 2019 for the 739 journals for which we have APC data for both years is 1,363 USD. This represents a 50% price increase during this time frame, an increase that is 3 times the inflation rate. Not all journals increased in price; some decreased or remained the same price. Nearly a quarter of the journals (23%) are ceased or not found. Most of this attrition rate can be attributed to new OA APC-based commercial publishers with a start-up strategy involving roll-out of a broad range of journals, with unsuccessful journals being retired.

Download PDF:  2010 update

Research question: what is the status, charging tendency (to charge or not to charge) and pricing trends of these journals?

Method

A subset of the OA Main 2019 Dataset (Morrison et al., 2019) containing Solomon & Björk’s 2010 data was used as the basis for this study. This sample was compared with the 2010 data and journals missing from OA Main (due to having been dropped from DOAJ prior to our study) were added to complete the sample. The current status of journals was developed using a pivot table. Pricing trends for 739 journals (tendency to increase or decrease in price) that are still charging APCs was calculated separately for journals with matching original currency (to avoid conflation with currency fluctuations) and non-matching currency in USD. An attempt was made to estimate APC for the 31 journals currently charging APPC but abandoned as the results did not match the APC trends and there is not enough detail in the 2012 study to be certain that the method of estimating APC was correct.

Results

Status

As illustrated in the following table and chart, the majority (779 or 74%) of the 2010 journals are still active and actively charging publication fees. 242 (23%) titles are ceased or not found. 25 (2%) have a status of other. Of these, 8 journals are now non-charging (no publication fee), for 11 journals it was not possible to determine whether or not there is a charge (no cost found), 2 journals are now hybrid, 3 are inactive, and one has been merged with another journal.

2010 journals by 2019 status
Actively charging 779 74%
Ceased or not found 242 23%
Other 25 2%
Grand Total 1,046

Active APC journals: trends analysis

The average APC reported by Solomon & Björk (2012) for 2010 was 906 USD. 779 of these journals are still active and charging publication fees; of these, 739 are still charging APCs and we were able to identify the amount. The average APC for these 739 journals in 2019 is 1,363 USD. This represents a 50% increase in the average APC for this group of journals. According to the Bank of Canada (n.d.) currency calculator, the cumulative inflation rate from 2010 – 2019 is 16.35% An average increase of 50% is more than 3 times the inflation rate.

Pricing direction trend

Not all journals increased in price. As the following table illustrates, 75% of journals increased in price, 18% decreased in price and 8% had no change in price. Where possible, original currency was used to avoid conflation with currency fluctuations.

Pricing trends by number of journals Matching currency Non-matching currency Total % of total
Journals decreasing in price 56 75 131 18%
No change in price 57 0 57 8%
Price increase 393 158 551 75%
Total l# of journals 506 233 739

Ceased / title not found analysis

Ceased journals

Based on knowledge of the history of pioneering APC OA based publishers, a publisher type analysis was conducted of the 210 ceased journals. 199 or 95% of these journals were developed by such publishers that pursued a strategy of starting out their business with a broad range of journals, then dropping journals that were not successful. 7 or 3% of these journals were started by publishers that have been acquired by other publishers that did not continue all of the others. No pattern was discerned for 4 (2%) of the journals.

2010 journals ceased as of 2019 – publisher type analysis
Publishers with broad range of journals start-up strategy
Bentham open 143
BioMed Central 12
Dove Medical Press 10
Frontiers Media S.A. 3
Hindawi Limited 31
Total broad range strategy 199 95%
Publishers that were acquired by other publishers
Co-Action Publishing 1
Libertas Academica 6
Total publishers acquired by other publishers 7 3%
Other
Academic and Business Research Institute 2
SAGE Publishing 1
SpringerOpen 1
Total other 4 2%
Total ceased journals 210

Title not found

A similar analysis was conducted on the 32 “title not found” journals. There was some overlap in the results; Bentham Open, one of the publishers with a broad range of journals start-up strategy, accounts for half of the total, with BioMedCentral accounting for 3 of the titles.

References

Bank of Canada (n.d.) Currency calculator. https://www.bankofcanada.ca/rates/related/inflation-calculator/

Morrison, H. et al. (2019). OA Main 2019: Dataset, documentation and open peer review invitation. Sustaining the knowledge commons. https://sustainingknowledgecommons.org/2019/11/20/oa-main-2019-dataset-documentation-and-open-peer-review-invitation/

Solomon, D. J. and Björk, B. (2012), A study of open access journals using article processing charges. J Am Soc Inf Sci Tec, 63: 1485-1495. doi:10.1002/asi.22673

Cite as:  Morrison, H. (2019). 2010 – 2019 APC update. Sustaining the Knowledge Commons. https://sustainingknowledgecommons.org/2019/11/26/2010-2019-apc-update/

APC price changes 2019 – 2018 by journal and by publisher

by Heather Morrison

Abstract

Pricing trends for 2018 – 2019 were compared on a per-journal and per-publisher basis. In contrast to the relatively unchanging global average APC, per-journal and per-publisher shows a mixture of trends. Most journals did not change in price from 2018 to 2019; 13% increased in price, 25% decreased. Journals included in DOAJ showed a greater tendency to increase in price (37%). Average price changes per publisher ranged from 0 (no change) to a 34% average increase in price. In some cases, price increases and decreases cancel each other out resulting in an average of 0 (no change) masking considerable change at the per-journal level. Only 2 publishers have APPCs; these have similar average prices. Average APC price by publisher ranges from 246 to 2,851 USD. UK-based not-for-profit publisher Ubiquity Press stands out as having the second-lowest average APC of 536 USD with no price increases.

Context

As reported by Singh & Morrison (2019), the global average APC has shown little change between 2010 and 2019, but variation in the mode and a constant increase in maximum APC and APPC, along with case studies by the SKC team, suggests that this does not give the whole picture of what is happening. The purpose of this study is to investigate whether change in APC or APPC is more obvious at the per-journal or per-publisher level.

Research question

Are there observable changes in APC or APPC at the per-journal or per-publisher level from 2018 – 2019?

Method

The data for this study is from the 2019 iteration of the APC longitudinal study; for documentation of the main study, a link to the dataset, and an invitation to open peer review, see Morrison et al. (2019). As reported by Singh & Morrison (2019), the majority of journals do not charge publication fees. Journals from the main spreadsheet were selected for which an APC or APPC amount is available for both 2018 and 2019. This resulted in a sample of 2,471 journals. Currencies were matched and original currency used for calculations wherever the same currency was listed in both years (2,255 APC journals). The reason for matching currency is to avoid conflation of currency fluctuations and pricing changes. For the remaining journals, APC in USD equivalent was done, using June 30, 2019 XE Currency Converter rates. The 2018 price was deducted from the 2019 price and the difference was divided into the 2018 price to determine the percentage of change.

A second sub-selection was drawn from this sample, limiting to journals that were listed in DOAJ on January 31, 2019, resulting in a sample of 1,514 journals. Of these, 1,394 match in currency in 2018 and 2019. Calculation of the numeric and percentage difference in price from 2018 to 2019 was calculated as described above. This eliminates journals by publishers that are no longer listed in DOAJ, newer journals that are not yet listed in DOAJ and other journals that are listed due to not meeting one of the DOAJ criteria, such as minimum number of articles published per year.

Per-publisher analysis was conducted using the second (DOAJ journals only) sample. For each publisher with more than one journal in the sample, the average APC or APPC was calculated as well as the average, minimum and maximum percentage change.

Results

Journals with APC or APPC data in both 2018 and 2019

As illustrated in the table and chart below, pricing trends on a per-journal basis varied. The majority of journals (62%) did not change in price; 13% decreased in price and 25% increased in price.

2018 – 2019 APC or APPC price changes
# journals % journals
Price decrease 317 13%
No change in price 1,528 62%
Price increase 626 25%
Grand Total 2,471

Journals in DOAJ 2019 with APC or APPC data in both 2018 and 2019

The following table and chart illustrate a somewhat different trend when limiting to journals included in DOAJ. The percentage of journals with price decreases is the same at 13%, but the percentage of journals with price increases in higher at 37%. Half the journals (50%) did not change in price.

2018 – 2019 APC or APPC price changes, DOAJ journals only
# journals % journals
Price decrease 191 13%
No change 758 50%
Price increase 565 37%
Grand Total 1,514

Price change 2018 – 2019 by publisher

The following illustrates that pricing changes from 2018 – 2019 varied by publisher. 6 publishers had no price changes from 2018 – 2019. 16 publishers did have price changes from 2018 – 2019. For the publishers with price changes, there were differences in the pattern of change. Nature and Sage’s price increases and price decreases cancel each other out for an average of no change in price. A few publishers either kept prices the same or increased them, however most publishers have a mixture of price increases and decreases. In interpreting the pricing trends, it is important to consider the average price. A publisher with no price increases may have a higher average APC than a publisher with price increases. The average prices will be highlighting in the next table.


Publisher Average APC 2019 * Currency APC or APPC in USD ****  Average price change % 2018 – 2019 Min. price change 2018 – 2019 *** Max. price change 2018 – 2019
Publishers with no price changes 2018 – 2019
APC Average APC 2019 *
American Geophysical Union (AGU) 1,800 USD 1,800 0%
De Gruyter 1,045 EUR 1,188 0%
Karger Publishers 2,783 CHF 2,851 0%
Public Library of Science (PLoS) 2,428 USD 2,428 0%
Ubiquity Press** 536 USD 536 0%
APPC (per-age not per-article) Average APPC 2019 *
Copernicus Publications (APPC) per-page not per-article 64 EUR 73 0%
Publishers with price changes 2018 – 2019
APC Average APC 2019 *
BioMed Central 1,533 GBP 1,947 10% -42% 123%
Dove Medical Press 1,983 USD 1,983 1% 0% 18%
Elsevier ** 1,633 USD 1,633 13% -50% 567%
Frontiers Media S.A. 2,297 USD 2,297 10% 0% 100%
Hindawi Limited 1,161 USD 1,161 6% -24% 95%
MDPI AG 848 CHF 869 23% 0% 227%
Nature Publishing Group 2,031 GBP 2,579 0% -21% 28%
Oxford University Press ** 1,572 USD 1,572 22% -51% 61%
PAGEPress Publications 473 EUR 538 1% 0% 20%
SAGE Publishing ** 1,429 USD 1,429 0% -59% 67%
SpringerOpen 1,205 EUR 1,370 8% -37% 109%
Taylor & Francis Group ** 693 USD 693 6% -56% 500%
Wiley 2,331 USD 2,331 3% -27% 100%
Wolters Kluwer 2,433 USD 2,433 1% 0% 6%
Wolters Kluwer Medknow Publications ** 246 USD 246 34% -57% 602%
APPC (per-page not per-article)
AOSIS (APPC) per-page not per-article 1,196 ZAR 85 5% 0% 19%
* Average prices of journals listed in DOAJ in Jan 2019 and for which APC data is available for both 2018 and 2019.
** Prices converted to USD June 30, 2019 as APCs listed in different currencies.
*** Negative numbers reflect price decreases
**** Based on June 30, 2019 currency conversion rate, XE currency

The following table shows the average APC in USD by publisher in ascending order (starting with the lowest price), along with average, minimum and maximum price changes from 2018 – 2019 by percentage.

Publisher 2019 Average APC or APPC in USD Average price change 2018 – 2019 % Min. price change 2018 – 2019 *** Max. price change 2018 – 2019
APC
Wolters Kluwer Medknow Publications ** 246 34% -57% 602%
Ubiquity Press** 536 0%
PAGEPress Publications 538 1% 0% 20%
Taylor & Francis Group ** 693 6% -56% 500%
MDPI AG 869 23% 0% 227%
Hindawi Limited 1,161 6% -24% 95%
De Gruyter 1,188 0%
SpringerOpen 1,370 8% -37% 109%
SAGE Publishing ** 1,429 0% -59% 67%
Oxford University Press ** 1,572 22% -51% 61%
Elsevier ** 1,633 13% -50% 567%
American Geophysical Union (AGU) 1,800 0%
BioMed Central 1,947 10% -42% 123%
Dove Medical Press 1,983 1% 0% 18%
Frontiers Media S.A. 2,297 10% 0% 100%
Wiley 2,331 3% -27% 100%
Public Library of Science (PLoS) 2,428 0%
Wolters Kluwer 2,433 1% 0% 6%
Nature Publishing Group 2,579 0% -21% 28%
Karger Publishers 2,851 0%
APPC (per-age not per-article)
Copernicus Publications (APPC) per-page not per-article 73 0%
AOSIS (APPC) per-page not per-article 85 5% 0% 19%

Discussion and conclusions

The data clearly demonstrate that the volume and direction of pricing changes varies by journal and by publisher. From 2018 to 2019, most journals did not change in price, some decreased in price, and others increased in price. Different APC based publishers display different tendencies and a wide range of average APCs, from 246 to 2,851 USD. The two APPC based publishers had similar pricing. The lowest average APC of 246 USD was for Wolters Kluwer Medknow. As noted by Avashti & Morrison (2019), most Medknow journals do not charge APCs; the average APC is likely impacted by the area served, as Medknow originated in India. It is not surprising that the 3 highest average APCs are associated with European based publishers (Wolters Kluwer, Nature, and Karger). However, the low average APC of UK based Ubiquity Publishing at 536 USD, combined with no price increases, is in marked contrast with Oxford University Press’ average APC of 1,572 USD and average price increase of 22%. This evidence of differences in APC / APPC and pricing trends by publisher supports, and is supported by, Shi & Morrison’s (2019) comparison of 4 pairs of publishers and sub-publishers.

References

Avasthi, N & Morrison, H (2019). Medknow 2019 – is this the best for India? Sustaining the Knowledge commons. https://sustainingknowledgecommons.org/2019/11/23/medknow-2019-is-this-the-best-for-india/

Morrison, H. et al. (2019). OA Main 2019: Dataset, documentation and open peer review invitation. Sustaining the knowledge commons. https://sustainingknowledgecommons.org/2019/11/20/oa-main-2019-dataset-documentation-and-open-peer-review-invitation/

Shi, A & Morrison, H. (2019). APCs comparisons among different publishers in 2019. Sustaining the knowledge Commons. https://sustainingknowledgecommons.org/2019/11/26/apcs-comparisons-among-different-publishers-in-2019/

Singh, S. & Morrison, H. (2019). OA journals non-charging and charging central trends 2010 – 2019. Sustaining the knowledge commons. https://sustainingknowledgecommons.org/2019/11/23/oa-journals-non-charging-and-charging-central-trends-2010-2019/

Cite as:  Morrison, H. (2019). APC price changes 2019 – 2018 by journal and by publisher. Sustaining the knowledge commons. https://sustainingknowledgecommons.org/2019/11/26/apc-price-changes-2019-2018-by-journal-and-by-publisher/


Open Access in 2019: Which countries are the biggest publishers of OA journals?

by Hamid Pashaei and Heather Morrison

Fifty percent of the open access (OA) journals listed in DOAJ in 2019 are published in Europe, and the United Kingdom is the biggest publisher of OA journals in DOAJ. It is important to note that we do not know the extent to which OA journals are fully represented in DOAJ; we understand that there is a parallel service called Chinese Open Access Journals. There are a few surprises in the 10 largest countries in DOAJ. Latin America and the U.S. are well represented as usual, while Indonesia is now the second largest country in DOAJ, and Poland, Iran, and Turkey, are among the top 10. This may reflect the work of the DOAJ ambassadors program.

The analysis of geographical data on Directory of Open Access Journals (DOAJ) shows that the European countries are leading the way in publication of Open Access journals by publishing 6133 journals in 2019, while Oceania and Africa published the least amount of OA journals in the same period.

The United Kingdom is the biggest publisher of open access journals by publishing 1471 journals in 2019. Indonesia and Iran are among the top 10 publishers of OA journals in 2019 that implies a growing interest in open access in these two countries.

Our team of researches collected the publication fee data for the open access journals in 2019 to see how the pricing to publish OA journals differs in different parts of the world. The results shows that while 71% of OA journals published in North American countries do not charge article processing charge (APC), but the average APC for the rest of the journals in North America is 1473 USD which is more expensive than any other part of the world. Asia with the average APC of 190 USD is the least expensive continent to publish OA journals.

Crawford (2019) published the results of his research on world open access journals in 2018 but he categorized the regions in a different way.

The following table shows the share of world OA journals in 2019 by each continent. It should be noted that the true number of OA journals in the world are higher, but here we are only analyzing the journals which geographical data on DOAJ was available.

The following table shows the percentage of journals which charge APC comparing those which do not charge APC in each continent. Because the information regarding APC was not available for some journals, the sum of APC and NO APC columns in the table for some rows is not equal to 100 percent.

Of the journals that charge APC, the average APC amount for each region is shown in the following table. The high standard deviation implies high variability in the range of prices.

According to the DOAJ data, there are 24 countries that have published more than 100 OA journals in 2019.

The summary of top 24 countries in publishing open access journals is shown below.

The method and documentation of the current research by Morrison et al. (2019) and the complete dataset is listed in the references section.

Cite as: Pashaei, H. & Morrison, H. (2019c). Open Access in 2019: Which countries are the biggest publishers of OA journals? Sustaining the knowledge commons. https://sustainingknowledgecommons.org/2019/11/26/open-access-in-2019-which-countries-are-the-biggest-publishers-of-oa-journals/

References
Morrison, H. et al. (2019). OA Main 2019: Dataset, documentation and open peer review invitation. Sustaining the knowledge commons. https://sustainingknowledgecommons.org/2019/11/20/oa-main-2019-dataset-documentation-and-open-peer-review-invitation/

Morrison, Heather, et al. 2019, “OA APC longitudinal study dataset 2019”,https://doi.org/10.5683/SP2/0DIPGE, Scholars Portal Dataverse, V1

Crawford, W. (2019). Gold Open Access 2013-2018: Articles in Journals (GOA4), Livermore, CA:2019. Retrieved Oct. 31, 2019 from https://waltcrawford.name/goa4.pdf


Open Access in 2019: Original currencies for article processing charge

by Hamid Pashaei and Heather Morrison

The original currency to charge article processing charge (APC) for more than 50 percent of world open access (OA) journals in 2019 recorded in our study is USD (for documentation of our procedures see Morrison et al (2019), while GBP and EUR are in the second and third place. 5 currencies (USD, GBP, EUR, CHF – Swiss Franc, INR – Indian Rupee) account for over 90% of the journals.

The following table and chart depict the original currency for OA journals in 2019.

When looking at the average APC in each original currency, it could be seen that the journals that their original currency is GBP charge the highest amount of APC. The top 10 most expensive APCs in original currency are listed below (all amount are converted to the USD).

Cite as: Pashaei, H. & Morrison, H. (2019a). Open Access in 2019: Original currencies for article processing charge. Sustaining the knowledge commons. https://sustainingknowledgecommons.org/2019/11/26/open-access-in-2019-original-currencies-for-article-processing-charge/

References
Morrison, H. et al. (2019). OA Main 2019: Dataset, documentation and open peer review invitation. Sustaining the knowledge commons. https://sustainingknowledgecommons.org/2019/11/20/oa-main-2019-dataset-documentation-and-open-peer-review-invitation/

Morrison, Heather, et al. 2019, “OA APC longitudinal study dataset 2019”,https://doi.org/10.5683/SP2/0DIPGE, Scholars Portal Dataverse, V1

Directory of Open Access Journals 2010 – Metadata. Retrieved at various dates from https://doaj.org/faq#metadata

APCs comparisons among different publishers in 2019

Abstract

This post features 4 comparisons between publishers and sub-publishers of fully open access journals that are included in our longitudinal APC study. Traditional publisher Wolters Kluwer owns two sub-publishers (or imprints). Wolters Kluwer Medknow journals tend not to charge APCs, and have low prices when they do charge. Wolters Kluwer Lippincott journals tend to charge, and prices are high. Indonesian-based Universitas Negeri Semerang is now one of the world’s largest OA journal publishers by the number of journals and appears to be new to online publishing using open-source software. Very few of their journals have APCs. The traditional Oxford University Press tends to have APCs, and their APCs are more than twice as high as a new UK-based not-for-profit OA journal publisher, Ubiquity Press. MDPI and Hindawi are very similar, both are fairly new, APC based commercial OA journal publishers; but Hindawi’s average APC is 44% higher than MDPIs. To understand the economics of OA journal publishing, it is necessary to take into account the strategies of particular publishers and even sub-publishers.

Research Question: are publishers and sub-publishers of fully open access journals pursuing observably different strategies with respect to publication fees (charging / non-charging, pricing strategies).

Method: 4 pairs of publishers or sub-publishers (imprints) were selected for comparison using the data from OA Main 2019, based on what appear to be differences in approach by publishers that are otherwise similar: Wolters Kluwer’s Medknow (India-based, OA in origin) & Lippincott (U.S. based, traditional subscriptions in origin); university-based publishers Universitas Negeri Semarang (Indonesia) & University of Oxford (U.K.); University of Oxford & Ubiquity (both U.K. based, traditional subscriptions v. OA origin) and MDPI & Hindawi (both commercial, OA in origin based on the APC model). Status of fully OA journals published by each publisher was compared, focusing on the tendency to charge (or not) and the amount of APC for charging journals.

Detail

1.Wolters Kluwer Medknow & Lippincott

Wolters Kluwer is one of the world’s oldest commercial scholarly publishers, having been established in 1836 in the Netherlands, where the company’s global headquarters is still located (Wolters Kluwer,2019a).

After acquiring Medknow in 2011, Wolters Kluwer focuses on develop strategic partnerships and leverage global brand and strengthen go-to-market (Wolters Kluwer,2019a). However, in Wolter Kluwer 2019 half-year financial report says: “Recurring revenues accounted for 80% of total revenues and grew 5% organically (HY 2018: 5%). Recurring revenues include subscriptions and other renewing revenue streams”. In the report, they also publish their major revenue (85.5%) comes from digital and service subscription and open access APC does not show as a certain type of revenues below (Wolters Kluwer,2019b).

Chart 1. Wolters Kluwer 2019 Half-Year financial Report

Medknow & Lippincott are different sub-publishers (imprints) belonging to Wolters Kluwer.

In 2019, Wolters Kluwers Medknow publishes 527 journals among which 99 journals (18.8%) have an APC, over half of journals do not charge a publication fee (66.6%). It is also important to notice that a few journals are redirecting to risky URL which is concerning as there are chances, it has been stolen by some other company (Avasthi, N & Morrison, H, 2019). Among the 99 journals with an APC that were studied, the highest APC is 1,500 USD and the minimal price is 9 USD. The average APC is 200 USD per article and, the most common publication fee (mode) is 150 USD per article.

2019 APC Wolters Kluwers Medknow website

For Wolters Kluwers Lippincott’s fully OA journals, over two-thirds of its journals (71.9%) have a publication fee. Among the 23 journals, the average APC is 1,756 USD per article, the range of APC (article proceeding cost) starts from 1,000 USD to 2,250 USD, and most common APC (mode) is 1,500 USD per article.
Compare to Medknow, Lippincott has a much higher average APC. Lippincott’s average publication fee is almost 9 times the average of Medknow which is 200 USD. A lower standard deviation of Medknow indicates that the publication fees tend to be close to the mean (200 USD) of the set, while a high standard deviation of Lippincott indicates that the publication fees are spread out over a wider range.

2019 APC Wolters Kluwers Lippincott website

2. Universitas Negeri Semarang & University of Oxford

Oxford University Press is one of the oldest scholarly publishers officially established in 1668. From the late 1800s, Oxford University Press began to expand significantly and makes most of its revenue from subscription and book sales.

Universitas Negeri Semarang , it appears to be fairly new to online publishing; in DOAJ the first year of online publication is 2009 or later for all the journals (column IO). Most of the journals appear to be published in Indonesian and/or English. The platform used is OJS – open source journal publishing software developed by the Public Knowledge Project. In other words, we have contrasted a very old, traditional, UK-based publisher with a new approach. (Note the size of OA journal publishing by UNS – see Appendix A.)

Universitas Negeri Semarang, based in Indonesia, is among the largest fully open access publishers with 96 journals. According to DOAJ webpage, Indonesia becomes the second largest country of publisher by number of journals ( see Appendix B.) and Indonesian rupiah becomes the 6th among all the original currencies for OA journals which accounts for 1.86%. The University of Oxford is a very well-known traditional scholarly publisher. These two university publishers have different approaches to APC. After comparing these two publishers we found Universitas Negeri Semarang has no publication fee for 88.5% of its journals while the University of Oxford has a fee for 80.3% of its fully open access journals.

3. University of Oxford and Ubiquity

As mentioned before, Oxford University Press is one of the oldest scholarly publishers which has a rich history which can be traced back to the earliest days of printing.

Ubiquity Press as an open access publisher of peer-reviewed academic journals and books was founded by researchers at University College London (UCL) in 2012. As a highly cost-efficient press, it provides access to the platform to give universities and societies the infrastructure and services they need to run their own presses through the Ubiquity Partner Network and allow societies to earn income from open access.

The average price of Ubiquity journals that only charge in GBP is 469 GBP (596 USD) and the most common price among those journals (mode) is 300 GBP (381 USD). The average price of Oxford University Press journals that only charge in GBP is 4543 GBP (5769 USD) and the most common price among those journals (mode) is 1250 GBP (1587 USD). The chart below shows the differences between Ubiquity and Oxford University Press on the APC that charged in GBP.

The overall average APC of Ubiquity journals that have a fee is 577 USD while the overall average APC of the University of Oxford is 1,549 USD. The average APC difference between these two publishers is 972 USD.

2019 APC Ubiquity publisher website

4.MDPI and Hindawi

Hindawi is one of the world’s largest publishers of peer-reviewed, fully Open Access journals. Built on an ethos of openness, it works with the global academic community to promote open scholarly research to the world. Based in institutions around the globe, it focuses on serving authors while preserving robust publishing standards and editorial integrity.

MDPI has supported academic communities since 1996 as a non-profit institute for the promotion and preservation of the diversity of chemical compounds. Based in Basel, Switzerland, MDPI has the mission to foster open scientific exchange in all forms, across all disciplines.
Mr. Dietrich Rordorf joined MDPI as Dr. Shu-Kun Lin’s assistant in August 2005. As an experiment, a modified version of the online submission and editorial system based on the Open Journals System (http://pkp.sfu.ca/ojs/) was launched by Dietrich for IJMS. Nowadays, MDPI has become the 7th largest publisher in number of articles published in 2018, and the largest publisher of open access articles in DOAJ in 2018.

MDPI and Hindawi charge fees for all the journals they published in 2019. However, their publication fees are different as the charts show below. Even though the highest APC are quite close for both publisher (2,049 USD for MDPI and 2,300 USD for Hindawi), the average APC for MDPI is 822 USD and 1,186 USD for Hindawi. We can also see the difference through mode. The most common price of Hindawi is 950 USD per article (Shi, A., 2019) while the most most common APC for MDPI journals is 350 CHF (359 USD) in 2019.

Cite as: Shi, A & Morrison, H. (2019). APCs comparisons among different publishers in 2019. Sustaining the knowledge https://sustainingknowledgecommons.org/2019/11/26/apcs-comparisons-among-different-publishers-in-2019/

Reference:

Morrison, H. (2018). MDPI 2019: price increases, some hefty, and more coming in July. Sustaining the knowledge https://sustainingknowledgecommons.org/2019/02/13/mdpi-2019-price-increases-some-hefty-and-more-coming-in-july/
Avasthi, N & Morrison, H. (2019). Medknow 2019 – is this the best for India? Sustaining the Knowledge commons. https://sustainingknowledgecommons.org/2019/11/23/medknow-2019-is-this-the-best-for-india/
Shi, A. (2019). Hindawi APC comparison 2018-2019. Sustaining the knowledge https://sustainingknowledgecommons.org/2019/11/05/hindawi-apc-comparison-2018-2019/
Brutus, W. (2015). Oxford Open: Increased the Number of Open Access Journal. Sustaining the knowledge https://sustainingknowledgecommons.org/2016/11/17/oxford-open-increased-the-number-of-open-access-journal/
Pasha, H. (2019). Open Access in 2019: Original currencies for article processing charge. Sustaining the knowledge https://sustainingknowledgecommons.org/2019/11/26/open-access-in-2019-original-currencies-for-article-processing-charge/
Pasha, H. (2018). Medknow in 2018: growing fast! Sustaining the knowledge https://sustainingknowledgecommons.org/2018/12/13/medknow-in-2018-growing-fast/
Hindawi (2019). About Hindawi. Retrieved Nov. 19, 2019 from https://about.hindawi.com/
MDPI (2019). Overview. Retrieved Nov. 19, 2019 from https://www.mdpi.com/about
Wolters Kluwer (2019)a. Our heritage. Retrieved Nov. 19, 2019 from https://wolterskluwer.com/company/about-us/our-heritage
Wolters Kluwer (2019)b. Wolters Kluwer 2019 Half-Year Report. Retrieved Nov. 19, 2019 from https://wolterskluwer.com/binaries/content/assets/wk/pdf/investors/press-releases/2019.07.31-wolters-kluwer-2019-half-year-report.pdf
Ubiquity Press (2019). About Ubiquity Press. Retrieved Nov. 19, 2019 from https://www.ubiquitypress.com/site/about-general/

Appendix A

Publishers in DOAJ in descending order of number of journals

As of Nov. 19, 2019, Universitas Negeri Semarang is the 12th largest publisher by number of journals listed in the Directory of Open Access Journals (DOAJ)

Elsevier (339)
BMC (328)
Sciendo (326)
Hindawi Limited (238)
SpringerOpen (202)
Wolters Kluwer Medknow Publications (194)
MDPI AG (191)
SAGE Publishing (165)
Taylor & Francis Group (163)
Wiley (109)
Dove Medical Press (103)
Universitas Negeri Semarang (90)

Appendix B

Country of publisher in DOAJ in descending order of number of journals

As of Nov. 21, 2019, Indonesia becomes the second largest country of publisher by number of journals listed in the Directory of Open Access Journals (DOAJ)

United Kingdom (1,609)
Indonesia (1,565)
Brazil (1,445)
Spain (755)
United States (741)
Poland (619)
Iran, Islamic Republic of (511)
Turkey (404)
Italy (387)
Russian Federation (367)

OA journals non-charging and charging central trends 2010 – 2019

by: Snehita Singh and Heather Morrison

This article summarizes qualitative analysis of APC (Articles Processing Charges) in 2019 and comparison of the central tendencies for APC and APPC (Article page processing charges) of the year 2010 and 2014-2019.

Dataset: Morrison, Heather, et al. 2019, “OA APC longitudinal study dataset 2019”, https://doi.org/10.5683/SP2/0DIPGE, Scholars Portal Dataverse, V1

OA APC Main 2019 dataset documentation

Morrison, H. et al. (2019). OA Main 2019: Dataset, documentation and open peer review invitation. Sustaining the knowledge commons. https://sustainingknowledgecommons.org/2019/11/20/oa-main-2019-dataset-documentation-and-open-peer-review-invitation/

Abstract

For the year 2019, we analyzed around 16000 journals that were fully open access in DOAJ (or whose publishers were listed in DOAJ) at some point from 2010 – 2019. More than half of these journals (58%) published had no publication charge.30% of the journals have publications fees. The most frequent model is APC (28% of total) followed by APPC (page charges), under 1%. In a few cases the cost was not specified or an unusual model such as charge per word was used. Of all the journals analyzed, the title of 4% of journals were not found and 3% of journals belonged to ceased publication. It was noted that 53 journals (less than 1%) also had hybrid charges (partially open access) in 2019. The global average APC was 908 USD. From 2010 the global average APC has ranged from 906 – 974 USD. The lack of change in the global average contrasts with variation in mode, reflecting change in the market, particularly ongoing entry of large numbers of new journals, gradually increasing maximum amounts for both APC and APPC, and substantial changes we sometimes observe when recording data for particular publishers. We conclude that continuing to calculate the global average is a less fruitful method of studying the transition to open access and plan to continue this longitudinal study by using the historical data gathered to focus on case studies.

Moreover, the highest value for APC in 2019 went up to 5800 USD whereas the lowest value remained at 0 USD. The SKC team distinguishes between journals that indicate an intention not to charge (no publication fee) and APC-based journals that have not yet begun to charge (identified as APC journals with APC of 0). The mode was noted to be 500 USD.

Abstract

We also analyzed the central tendencies for APC and APPC for over the years of this study. It was observed that there wasn’t much change in the global average of APCs and APPCs from the year 2010 to 2019 and it ranged between 840 to 1090 USD.


The global average of APPC was noted to vary between 50 to 110 USD.


The highest value of APCs observed each year shows a gradual upward trend over the years and the lowest value of APCs has remained between 0 to 8 USD.

For APPC, the highest value shows a steep increase reaching up to 1844 USD in 2019 (for Karger’s, Dementia and Geriatric Cognitive Disorders Extra, 4 times higher than the second highest APPC) when compared to the previous years. The minimum value of APPCs varied between 0 to 5 USD over the years.


It was observed that the mode of APCs between year 2010 and 2019 kept varying from year to year. It was lowest in the year 2014 and 2017 with 0 USD and highest in the year 2016 and 2018 with around 1800 USD.


For APPCs, it reached to a minimum of 30 USD in 2015.Apart from that, it remained between 50 to 90 USD over the years.


Discussion and conclusions

The global average (mean) APC has changed little over the years. In 2010, Solomon & Björk (2012) recorded an average of 906 USD. Our 2014 data yielded an average of 964 USD (Morrison et al., 2015), in 2017, 974 USD (Morrison, 2018), and for 2019 we record an average of 908 USD. This contrasts with variation in mode or most common APC and gradually increasing maximum APC and APPC and the changing prices we observe when studying particular publishers (most often price increases, sometimes a mix of price increases and decreases). For example, Shi (2019) reports a 2019 Hindawi average APC of 1,186 USD, well above the global average and a 14% increase over the 2018 Hindawi APC. As reported by Pashaei and Morrison (2019), DeGruyter is rapidly expanding its collection of open access journal titles, primarily through its new Sciendo imprint. Most of the OA journals of this commercial publisher do not charge publication fees; of those that do, the range of APC prices is much lower for Sciendo than De Gruyter. A focus on the global average APC does not tell the story of what is happening in the transition to open access. We conclude that continuing to calculate a global average APC is less fruitful in understanding OA transition, and for this reason our future research will build on the OA Main dataset for historical context for a series of case studies.


References

Solomon, D. J. and Björk, B. (2012), A study of open access journals using article processing charges. J Am Soc Inf Sci Tec, 63: 1485-1495. doi:10.1002/asi.22673

Crawford, W. (2019). Gold Open Access 2013-2018: Articles in Journals (GOA4), Livermore, CA:2019. Retrieved Oct. 31, 2019 from https://waltcrawford.name/goa4.pdf

Morrison, H.; Salhab, J.; Calvé-Genest, A.; Horava, T. Open Access Article Processing Charges: DOAJ Survey May 2014. (205). Publications 3: 1-16. http://www.mdpi.com/2304-6775/3/1/1

Morrison, H. (2018). Global OA APCs (APC) 2010–2017: Major Trends. Chan, L. & Pierre Mounier. P. , eds. ELPUB 2018, June 2018, Toronto, Canada. <10.4000/proceedings.elpub.2018.16>.  Retrieved July 5, 2018 from https://elpub.episciences.org/4604

Pashaei, H. & Morrison, H. (2019). De Gruyter and Sciendo Open Access journals expanding in 2019. Sustaining the knowledge commons. https://sustainingknowledgecommons.org/2019/10/16/de-gruyter-and-sciendo-open-access-journals-expanding-in-2019/

Shi, A. (2019). Hindawi APC comparison 2018-2019. Sustaining the knowledge commons. https://sustainingknowledgecommons.org/2019/11/05/hindawi-apc-comparison-2018-2019/

Cite as: Singh, S. & Morrison, H. (2019). OA journals non-charging and charging central trends 2010 – 2019. Sustaining the knowledge commons. https://sustainingknowledgecommons.org/2019/11/23/oa-journals-non-charging-and-charging-central-trends-2010-2019/

OA Main 2019: Dataset, documentation and open peer review invitation

Update Jan. 20, 2020

Thank you to those who provided comments. No changes were suggested for the dataset per se; the documentation has been revised to reflect the comments and the final version is now available here.

OA APC Main 2019 dataset documentation final

This is an invitation to participate in an open peer review of the OA APC Main 2019 dataset, its documentation and the value of research blogposts made possible through this project. While feedback on the OA APC project is appreciated at any time, the formal open peer review period is Dec. 1, 2019 – Jan. 15, 2020. My perspective is that open peer review is in an early phase where experimentation with different approaches could be useful to develop future best practices.

For this reason, reviewers are welcome to submit comments in the format or venue of their choice. Comments on this blogpost are the most convenient approach for the author. Signed comments are preferred. At the end of the formal open peer review period (Jan. 15), I will write a summary of the open peer review process, including all comments and responses where warranted. Comments to date and replies are posted here.

Links:

Questions to consider in the open peer review process:

The following are meant as guidelines only. Please feel free to focus on one or more specific questions that you find of interest and/or feel qualified to comment on, including questions not asked.

1. Importance and relevance of the research questions: the project’s research question and sub-questions (from the documentation) are as follows:

Research question

What trends can be observed in APCs over time? Subquestions:

    • Will competition emerge, or will an inelastic market transition or reappear?
    • Will the percentage of journals that are charging and non-charging remain the same or change?
    • Will fully OA journals continue to actively publish, cease, change to partially OA (hybrid) or non-OA journals?
    • What are the OA publishing and charging / non-charging trends and practices of particular publishers? (Note: results of individual research project done sustainingknowledgecommons.org)

Are any of the research questions important, relevant, or otherwise? Do you have any advice for the research team or potential downstream researchers using the dataset about research that you think will be important and relevant in future? Do you have any suggestions for further research?

2. Adequacy of the documentation: is the documentation of the dataset sufficient so that a downstream researcher could continue this research if desired and/or use a subset of the dataset for further research?

3. Limitations: Are the limitations of the dataset sufficiently well described? Is anything missing?

4. Alternative approaches: Are the alternative approaches sufficiently well described?

5. Errors in the dataset: Please note any errors found in the dataset (be specific).

6. Other: please provide feedback on any aspects of the dataset or its documentation not covered in the above questions.

Second update January 8: thanks to Heather Staines from MIT’s Knowledge Futures Group for initiating a conversation on open peer review processes via e-mail and agreeing to publish on the blog. This conversation (which prompted the initial procedural update) can be found here.

Procedural update January 8: there are diverse approaches to data documentation and open peer review. Peer review of an earlier version of this dataset and documentation was published in MDPI’s innovative journal Data, designed for this purpose (Morrison et al. 2017). Tools have been, and are being, developed to provide technical support for new, more open approaches to peer review such as hypothes.is, which facilitates online annotations. I see tremendous potential for open peer review, online annotations, and collaborative online writing. However, I see the process of transformation as in an early stage where experiments (like this one) and open discussion are more important than technical solutions. In other words, my choice of this approach – blogpost and open-ended invitation –  is deliberate. Discussion about open peer review process and potential is welcome, although it is a side-conversation to reviewing this dataset designed to facilitate study of longitudinal trends in article processing charges.

Cite as:

Morrison, H. (2019). OA Main 2019: Dataset, documentation and open peer review invitation. Sustaining the Knowledge Commons. Retrieved from https://sustainingknowledgecommons.org/2019/11/20/oa-main-2019-dataset-documentation-and-open-peer-review-invitation/

Reference
Morrison, H., Brutus, W., Dumais-Desrosiers, M., Kakou, T. L., Laprade, K., Mehri, S., … Wheatley, S. (2017). Open Access Article Processing Charges (OA APC) Longitudinal Study 2016 Dataset. Data, 2(2), 13. https://doi.org/10.3390/data2020013


Rev. Jan. 20, 2020


Hindawi APC comparison 2018-2019

Abstract:

481 Hindawi journals were analyzed. 226 (47%) journals published at some point from 2010 – 2019 have ceased publication, 7 cannot be found on the Hindawi website anymore and 1 has been transferred to another publisher. In 2019, there are 247 journals actively publishing on the Hindawi website. All the journals are charging APCs. The average price is 1186.44 USD, an increase of 14% over the 2018 APC (1040.30 USD). Compared to the US inflation rate for 2018 of 2.44%(“U.S. Inflation Rate 1960-2019” n.d.), the publication fee rises more than 5 times. Among active journals, 17% of the 217 journals did not change in price; 30% journals decreased their price while more than half (53%) of the journals increased price. The amount of price increase starts from 25 USD up to 1350 USD. 14 journals appear to have switched from “no fee” to “fee”, with different APCS from 750 USD to 1350 USD.

Most journals that not found on the website in 2018 now been illustrated ceased on the web page with the specific ceased year and where to find previous publication articles which could be good practice for authors who are trying to find the latest information about specific journals. it also benefits other publishers to follow the lead.

Detail:

Table 1: 2019 Hindawi Journal Publication and APC status summary

Hindawi has 481 journals in 2019. Among these journals, 226 of them were reported ceased on Hindawi’s website. In 2018, most of the ceased journals cannot be found in the website but they have been specified on the webpage about when this journal is ceased and where can readers find previous articles published in the journal. This is a good practice. Here is a example of one of the ceased title.

screenshot from Hindawi website

Price changes 2018-2019

Hindawi has 232 active journals listed on its website in 2018. In 2019, there are 247 journals actively publishing on the Hindawi website. There are 15 journals that cannot be found on the website now can be searched which represents a 6.47% increase in journal numbers of Hindawi.

The average publication fee we found from the Hindawi’s website in 2018 is 1040.30 USD. There are 14 journals that had no publication fee in 2018 in contrast with no journals with no publication fee in 2019 and for most journals the publication fee is 1000 USD per article. The range of APC (article proceeding cost) starts from no publication fee which is zero to 2250 USD.

This average takes into account the 15 journals’ APC for the year 2019. This year, the majority of journals have a publication fee of 950 USD per article. Obviously, every journal found on the Hindawi website does have a publication fee from this year. The minimum cost is 650 USD up to 2300 USD. Graph 1 and Graph 2 below shows the frequency of APC for different prices in two years.

Table 2 2018 & 2019 Hindawi active titles APC status summary

Graph 1: price distribution for 2018

Graph 2: price distribution for 2019

Of the 247 journals total:

  • 15 “new” journals are added in 2019 (including in 2019 overall analysis but not 2018-2019 change analysis)
  • Journals with status: no publication fee coded as 0 in change analysis.

Total journals included in the price change analysis:

  • 2019 overall: 232
  • 2018-2019 comparison: 217

Of the 217 titles, as illustrated in the chart and table below, a majority of these journals (53%) increased in prices in USD from 2018 to 2019, while a third (30%) decreased in price and a few (17%) did not change in price.

For the 116 journals that increased in price, the increases in percentages ranged from 2.22% to 95% (slightly under double in price).

Among the 65 journals with APC price decreases, the drop in percentage ranged from 5% to 24%.

Working dataset : https://sustainingknowledgecommons.files.wordpress.com/2019/11/hindawi-analysis_2019_prep_version-0.xlsx

Cite as: Shi, A. (2019). Hindawi APC comparison 2018-2019. Sustaining the knowledge commons. https://sustainingknowledgecommons.org/2019/11/05/hindawi-apc-comparison-2018-2019/

Selected previous posts on Hindawi:
Morrison, H. (2018). Recent APC price changes for 4 publishers (BMC, Hindawi, PLOS, PeerJ). Sustaining the knowledge commonshttps://sustainingknowledgecommons.org/2018/04/13/recent-apc-price-changes-for-4-publishers-bmc-hindawi-plos-peerj/
In brief: Hindawi April 2016 – November 2017: mixed picture, price increases a bit concerning
Brutus, W. (2017). Hindawi: comparaison 2016 – 2017. Soutenir les savoirs communshttps://sustainingknowledgecommons.org/2017/04/22/hindawi-comparaison-2016-2017/
In brief: French – highlights: the mode (most common APC) was $600 USD in 2016, $1,000 in 2017
Salhab, J. (2016). Hindawi publisher: 2016 findings and longitudinal comparison of APC rates. Sustaining the knowledge commonshttps://sustainingknowledgecommons.org/2016/04/27/hindawi-publisher-2016-findings-and-longitudinal-comparison-of-apc-rates/
​In brief: Hindawi previously used a strategy of rotating free publication in journals, mentioned in this post; the most common APC in both 2015 and 2016 was $600; comparing 2010 and 2016 data, we see a mixed picture with some prices increasing and others decreasing.
Salhab, J. & Morrison, H. (2015). Who is served by for-profit gold open access publishing? A case study of Hindawi and Egypt. Sustaining the knowledge commonshttps://sustainingknowledgecommons.org/2015/04/10/who-is-served-by-for-profit-gold-open-access-publishing-a-case-study-of-hindawi-and-egypt/
Highlights: as reported by Poynder (2012), Ahmed Hindawi, (from Egypt) founder of Hindawi, confirmed a revenue of millions of dollars from APCs alone – a $3.3 net profit on $12 million in revenue, a 28% profit rate. Hindawi is highly regarded as a leading reputable open access publisher. This commercial Egyptian success story is contrasted with high APC for the most prestigious journals and English-language- only journals that suggest that this approach is not helpful for Egypt’s researchers.

Reference:

“U.S. Inflation Rate 1960-2019.” n.d. Accessed October 31, 2019 from https://www.macrotrends.net/countries/USA/united-states/inflation-rate-cpi

Poynder, R. (2012).The OA interviews: Ahmed Hindawi, founder of Hindawi Publishing Corporation. Retrieved March 10, 2015 from http://www.richardpoynder.co.uk/Hindawi_Interview.pdf

Cite as:

Shi, A. (2019). Hindawi APC comparison 2018-2019. Sustaining the Knowledge Commons. Retrieved from https://sustainingknowledgecommons.org/2019/11/05/hindawi-apc-comparison-2018-2019/


Finding: Article processing charges (APCs) decreased in ANSInet

According to the Asian Network for Scientific Information (ANSInet) website, the article processing charges (APCs) for almost all the listed journals dropped from 625 USD in 2018 to 325 USD in 2019 which is 48 percent decrease. Only the ‘International Journal of Pharmacology’ dropped from 1000 USD to 625 USD, about a 38 percent decrease. On the contrary, two journals experienced a slight increase for their article processing charges (APCs) from 250 USD to 275 USD. This is good news for authors who do not have enough funding but try to publish through Asian Network for Scientific Information (ANSInet). From the journal number perspective, 3 new journals have been added in the Asian Network for Scientific Information (ANSInet).

ANSInet is included in our study as this publisher was formerly in DOAJ. ANSInet no longer listed in DOAJ now; we do not know whether this publisher did not complete the re-application process or if ANSInet applied and was not accepted.

citation: Shi A. (2019). Finding: Article processing charges (APCs) decreased in ANSInet. Sustaining the Knowledge Commons 
commons: https://sustainingknowledgecommons.org/2019/10/16/finding-article-processing-charges-apcs-decreased-in-ansinet/