The 2021 DOAJ (The Directory of Open Access Journals) publisher group comprises a large number of very small publishers (typically with only one journal), and very few large publishers. Our purpose is to demonstrate publishers’ long-tail tendency and reveal its connection with the tendency of APC (article processing charge) or NO APC publications. As a result, we ascertain a “long-tail” of publisher size in all three groups and a “the smaller, the NO-APCer” tendency.
Why does the relation between OA-APC (open access-) and publisher size need to be brought to the forefront? To answer this question, we need to understand a bit more about the context of OA publishing activities. As illustrated by Crow (2006), Edgar & Willinsky (2010) and Morrison (2012), from the mid-20th century onwards, the components of scholarly publishing began to shift: non-profit university and society publishers started to lose ground, while commercial publishers stepped into an era of rapid development. Unlike for-profit publishers with more robust survivability in commercialization, non-profit publishers, especially the smaller ones, are facing various internal and external challenges: “market consolidation”, “aggressive pricing”, “flat library budgets”, “migration to online distribution”, “structural constraints”, “undercapitalization”, etc., listed Crow [1]. We emphasize the “smaller ones” because “the vast majority of society and non–profit publishers run independent and very small journal publishing operations” [2]. Thus, the limitations mentioned above concern the plight of most society and non-profit publishers, especially for small publishers who prioritize academic quality or social needs, to the extent that they cannot balance profit and non-profit.
Several scholars proposed various recommended schemes. For example, Crow [3] suggests publishing cooperatives, which would allow small non-profit publishers “to remain independent while operating collectively to overcome both structural and strategic disadvantages”. Another solution is offered by Edgar & Willinsky (2010) and Morrison (2012): open access. Many studies have shown that open access could bring “growth rates in new titles, participation rates from developing countries, and extremely low operating budgets”, and maximize “access to research and scholarship, as an alternative to traditional scholarly society and commercial publishing routes” [4].
Although the transition from offline to online open access publishing requires a human and material investment, it is increasingly an attractive option in the context of today’s widespread web presence. Until recent years, in addition to the large commercial publishers who dominate the major publishing markets, the global OA market is “marked by a very long-tail and extensive involvement by very small, often university or society publishers”, as Morrison pointed out in 2018 [5]. In Gold Open Access Journals 2011-2015. Crawford (2016) found that small journals are less likely to charge through abundant materials about the correlation between journal size, tendencies to charge/non-charge, and amounts of charges. In other words, the larger the journal, the higher the APC. We would like to corroborate these statements with our research of DOAJ 2021 metadata.
Definitions & Explanation
In this study, we consider DOAJ publishers who released 10 or fewer journals (at the time of being sampled) as relatively “small” publishers and those who released more than 100 journals as rather “large” publishers. The rest are grouped as “medium” publishers with 11-100 journals. These definitions only aim to better distinguish publishers of different sizes in our data scope.
We divide the DOAJ publishers into three primary groups: all publishers’ group, APC charging publishers’ group and NO APC publishers’ group. We use “mixed publishers” to describe publishers that appeared in both APC and NO APC lists. Our research is carried out from three aspects: observation of the three primary groups, observation of the “non-mixed” publishers’ group and observation of the “mixed” publishers’ group.
The data in this project was initially downloaded from DOAJ (Directory of Open Access Journals) metadata (15,691 journals, 4,292 APC journals, 11,399 NO APC journals), then cleaned up by our SKC (Sustaining the Knowledge Commons) team. The clean-up work revolved around correcting the wrong position of the data and creating a modified publisher name column for this exercise. During the work, we realized that creating a consistent publisher name list was challenging. As reported in Some Limitations of DOAJ Metadata for Research Purposes (Zhao, Borges & Morrison, 2021), there were a large number of variations and inconsistencies of publisher names, such as duplicates with differences in punctuation and/or characters (e.g. “Abant İzzet Baysal Üniversitesi” vs. “Abant İzzet Baysal University”), extra spaces at the beginning or the end of names (e.g. “Abant İzzet Baysal University” vs. “Abant İzzet Baysal University⎕”), invalid URLs, etc. More details can be found in the open dataset “DOAJ_metadata_2021_01_05_with_SKC_clean_up” (Zhao, Borges & Morrison, 2021).
This research is only for the journals and publishers listed in DOAJ as of Jan.5, 2021. There are other fully open access journals and publishers not listed in DOAJ, or previously listed but then de-listed for some unknown reasons. We understand that it is challenging to create a precise list of publishers because of the complexity of publishers’ backgrounds (Morrison, 2019). In this study, we concentrate more on the trends rather than precise details. What’s more, we focus solely on whether the journals or publishers charge APC, not how much is charged.
Observation of the three primary groups
First, we separate the DOAJ publishers into three groups: all publishers’ group (Table 1 & Chart 1), APC’s group (Table 2 & Chart 2) and NO APC’s group (Table 3 & Chart 3).
Table 1 – ALL DOAJ publishers’ group (2021)
(Total DOAJ journals’ number: 15,691)
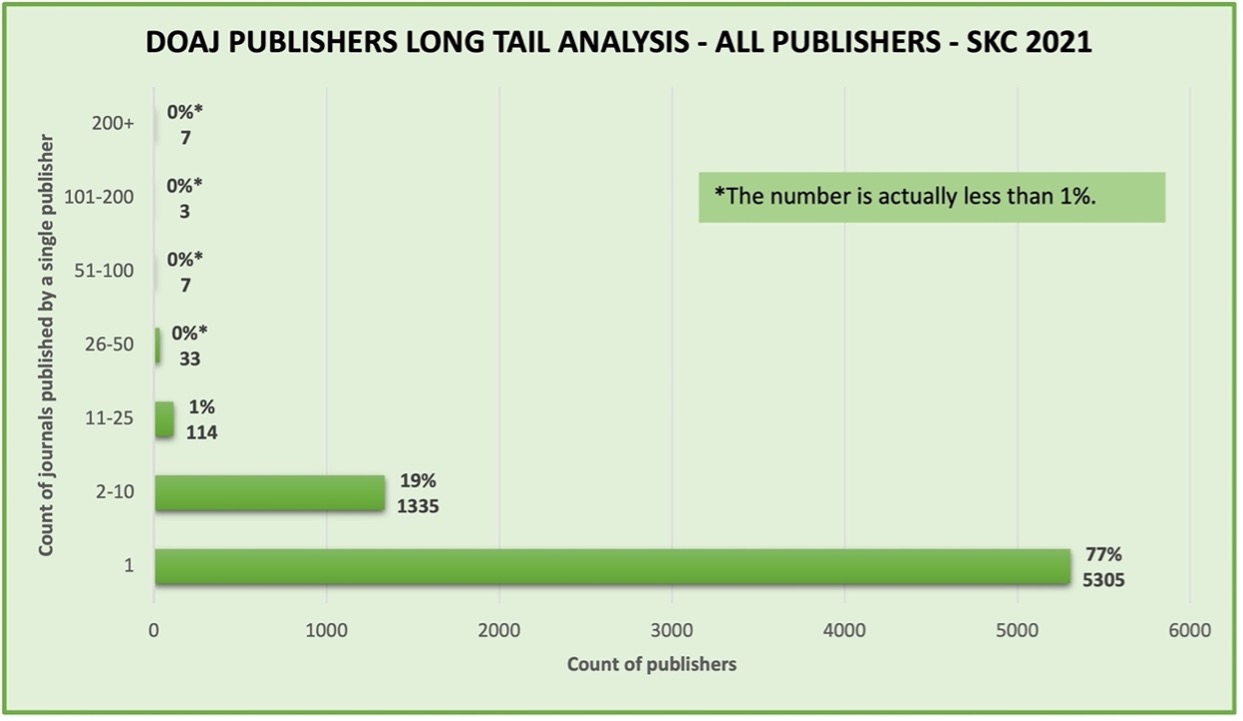
Chart 1 – ALL DOAJ publishers’ group (2021)
Table 2 – DOAJ APC group (2021)
(Total count of DOAJ APC journals: 4,292)
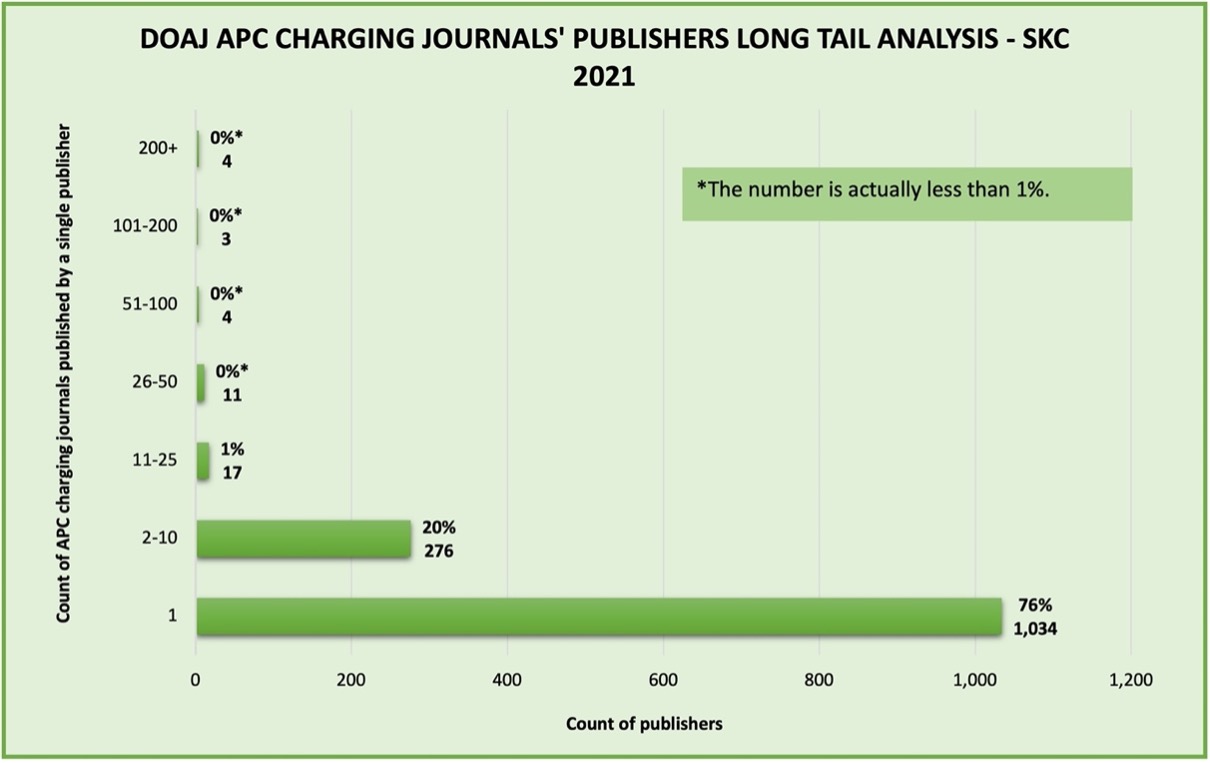
Chart 2 – DOAJ APC group (2021)
Table 3 – DOAJ NO APC group (2021)
(Total count of DOAJ NO APC journals: 11,399)
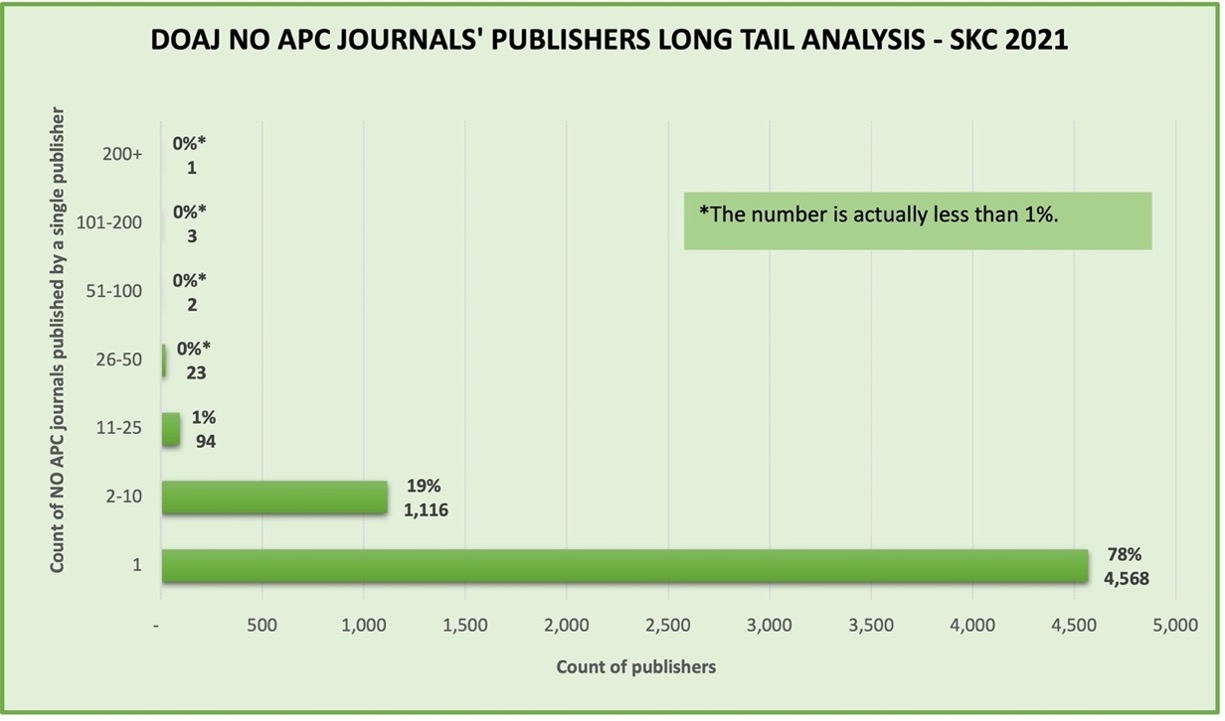
Chart 3 – DOAJ NO APC group (2021)
Individually, each group shows an evident “long-tail”. In the ALL publishers’ group (see Table 1 & Chart 1), among the 6,804 publishers identified in DOAJ, 1,349 published APC journals, and 5,807 published NO APC journals (the numbers do not add up to 6,804 because some of them are “mixed” publishers). 77% of this group are small publishers with only one journal publication. The small publishers still occupy the main part in the other two groups (see Table 2,3 & Chart 2,3), 76% for the APC group and 78% for the NO APC group.
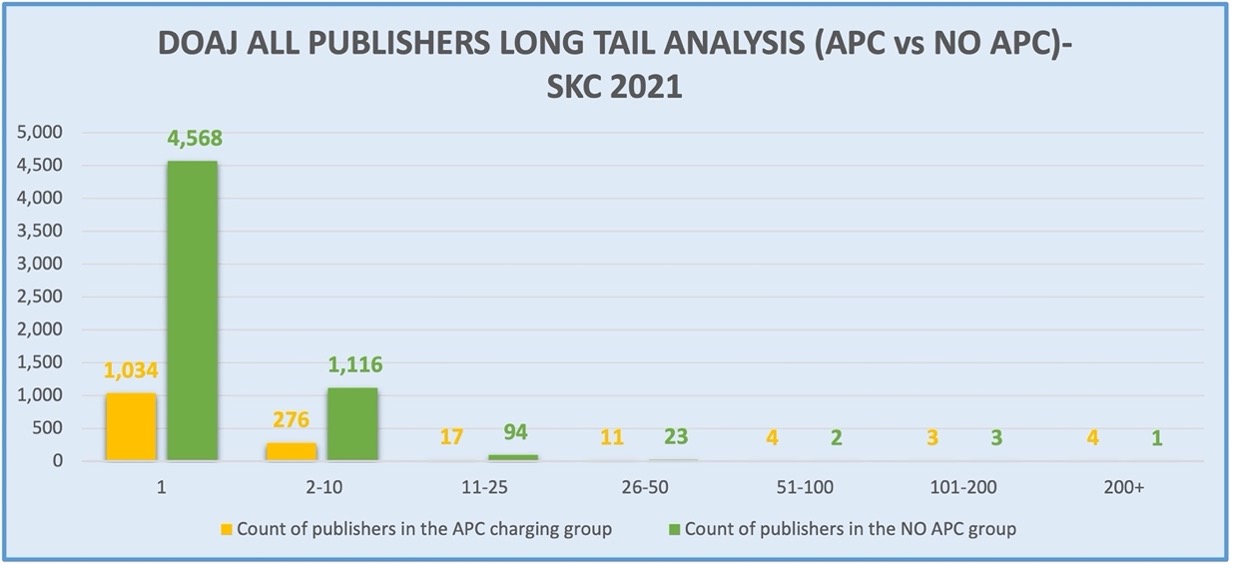
In the second place, a comparison between APC and NO APC groups can be made. Although small publishers occupy a similar share in each of the three groups, we can notice a big difference in their numbers. As illustrated in Table 4 & Chart 4 below:
Table 4 – DOAJ ALL publishers – APC group vs NO APC group (2021)
Chart 4 – DOAJ ALL publishers – APC group vs NO APC group (2021)
In the range of “publishers with 1 journal”, the number of NO APC publishers (4,568) is about 4 times that of the APC publishers (1,034); in the range of 2-10, NO APC publishers are about 3 times more than the other; in the field of 11-25, the number is about 4 times more. However, for the publishers with 51+ journals, the number of APC publishers is more or equal to NO APC publishers. In the largest publishers’ range (200+ journals), there are 4 charging publishers and only 1 non-charging publisher.
Thus, without considering the “mixed” publishers’ situation, we assume that even both APC and NO APC groups showed a “long-tail” (76% of 1-journal-publishers in the APC group, and 78% of which in the NO APC group), small DOAJ publishers seemed more likely to publish non-charging journals; large DOAJ publishers seemed more likely to publish charging journals. We boldly name this tendency as “the smaller, the NO-APCer’ trend.
Besides, it is essential to notice some exceptions. Some large publishers release more NO APC journals (details in Table 7): Wolters Kluwer Medknow Publications has 46 APC journals and 161 NO APC journals; SpringerOpen has 96 APC journals and 114 NO APC journals; Sciendo has 44 APC journals and 257 NO APC journals. We will discuss more in the following sections.
Observation of the “non-mixed” publishers’ group
We identify 352 duplicated publishers by comparing the APC / NO APC group, which means 352 “mixed” publishers. For making the research results more rigorous, we exclude the “mixed” group and study the rest of the publishers. We find that the tendencies of “long-tail” and “the smaller, the NO-APCer” are still evident in the “non-mixed” group. Please see Table 5 & Chart 5 below:
Table 5 – “Non-mixed” publishers – APC group vs NO APC group (2021)
Chart 5 – “Non-mixed” publishers – APC group vs NO APC group (2021)
Among 6,452 identified “non-mixed” publishers, 82% are small publishers with only 1 journal. Comparing with the 77% 1-journal-publishers in the ALL publishers’ group (Table 1 & Chart 1), 82% is a similar “long-tail”.
“The smaller, the NO-APCer” trend is also evident. If we compare the percentages of APC and NO APC groups in this chart, 69% of 1-journal-publishers are non-charging, which is way more than 13% charging 1-journal-publishers.
Observation of the “mixed” publishers’ group
We study this group separately because, from the research above, we know that almost all the large DOAJ publishers (100+ journals) are “mixed” (except for Hindawi Limited with 229 journals which is a pure APC publisher based on our data scale). We are curious about whether the “long-tail” and “the smaller, the NO-APCer” trend also existed in this group.
The first discovery is an explicit “long-tail” because 75% of the “mixed” publishers are small. Please see Chart 6 below:
Then we see a recognizable “the smaller, the NO-APCer” trend. After a comparison between the count of APC journals and the count of NO APC journals published by the same “mixed” publisher, we identify three relations: “number of APC journals = number of NO APC journals”, “number of APC journals > number of NO APC journals” and “number of APC journals < number of NO APC journals”.
We consider the inequivalence (“>” and “< “) between the counts of APC journals and the counts of NO APC journals as “active” tendency indicators and the equivalence relation (“=”) as “inactive” elements. Thus, to highlight the tendency, we exclude all the “=” and only concentrate on”>” and “< “. By this step, Table 6 below has been created:
Table 6 – DOAJ “mixed” publishers’ trends (2021)
For those who release 3 journals, other than the 101-200 group who publishes more APC journals than NO APC journals, and the 200+ group with an “inactive” “=”, the other publishers with less journal volume are biased toward NO APC publication. At this point, we confirm “the smaller, the NO-APCer” trend in the “mixed” publishers’ group.
For further discussion, if we investigate the large “mixed” publishers’ group (100+ journals), as shown in Table – 7 below:
Table 7 – Investigation of “Mixed” Publishers with 100+ journals (2021)
In this group, 6 of them publish more APC journals than NO APC journals, while 3 of them publish more NO APC journals. The difference in counts of journals of those 6 publishers could be significant. For example, Wiley (133 charging journals > 8 non-charging journals), Taylor & Francis Group (143 charging journals > 21 non-charging journals), SAGE Publishing (151 charging journals > 23 non-charging journals), etc. Because of these enormous differences of counts, even though there are 166 “mixed” publishers publish more non-charging journals, which is way more than the other 92 who release more charging journals, the count of non-charging journals in total (2,608) is still very close to that of charging journals in total (2,583).
Discussion
APC trends can also be analyzed in terms of other influencing factors: publisher type, subject of journal, country of publication, etc. Researchers can perform more diverse analyses based on more layers of data, just as Crawford (2016) did. In in-progress research of SKC, Morrison and the research team (Morrison & al., 2021) investigated APC by publisher type (government, institute, non-profit, independent, society or institution, university press, commercial, society, university) according to DOAJ data in 2019. As a result, universities published the most significant number of no-fee journals (7,857, 75% of the 10,463 no-fee journals in total), and the society publishers came second (1,414). Commercial publishers stood out by having much more charging journals than no-fee journals (1,575 vs 275). Combined with our study, it can be speculated that most small DOAJ publishers are university or society publishers with a no-fee tendency. This discovery corroborates Morrison’s thoughts in 2018 (Morrison, 2018b). Besides, the tendency to charge fees of commercial publishers coincides with our study of large publishers’ group.
In addition, we must admit that if the amount of APC is included in the scope of the study, the results may change somewhat. Because some publishers charge modestly and some ask for very high prices (especially for-profit high prices), and it is unfair to mix them without careful investigation (Crawford, 2011). For publishers in the charging group, their listing does not mean that their fees are necessarily unreasonable. Therefore, it is necessary to emphasize that our study concentrates more on the rough trends of charging/no charging based on publisher size as a division.
For a more in-depth discussion, we add the perspective of longitudinal analysis. We focus our discussion on two contrasting groups, large and small publishers. From our study, we know that almost all the large DOAJ publishers (100+ journals) are “mixed”, and most of them are commercial publishers, including the four largest traditional commercial publishers (Elsevier, SpringerNature, which includes SpringerOpen and BMC, Taylor & Francis, and Wiley). Based on the research of the SKC (Morrison, 2018a), Elsevier, as the world’s largest scholarly publisher, are “mixed” by having a large number of non-charging journals in 2017. But despite attempts at strategies, Elsevier lost many non-charging journals produced in partnership with societies and universities in 2018. Now, as we can see in our study, they may have fewer non-charging journals.
From this point, we speculate that some publishers can conduct relatively more non-charging publications is probably because that they got support from universities and governments. For example, the large “mixed” publisher Sciendo has much more non-charging journals than charging journals based on our data. According to Pashaei & Morrison (2019), Sciendo added more than 300 OA journals in 2019, most of which were “published through collaboration with different universities and academic societies and institutions in Europe”. A recent study of OA diamond journals [6] also confirmed that the economy of these journals “largely depends on volunteers, universities and government” (Bosman, Frantsvåg, Kramer, Langlais & Proudman, 2021).
Even large publishers with relatively financial solid resources may losing journals due to financial problems or other reasons, so that we can imagine the more difficult situation for small publishers, especially for those with only 1 journal. Perhaps, the small non-profit publishers with limited financial resources should explore the possibilities of more no charging OA models, instead of going with the flow and just raising prices in the for-profit competition. It is important to maintain operations while guarding the freedom and fairness of academic publishing. Based on the current situation, we need more patience to establish a healthy competitive publishing environment.
Not only do small publishers need to figure out how to grow in the long run and attract more authors and readers, but authors can also reach out to small publishers and discover their value, and same for readers. Here comes another purpose of our study: to call attention to small publishers and encourage interaction between authors, readers, funding sources and small publishers. There are often misunderstandings between these groups that are harmful to the OA movement, as discussed by Peter Suber in an interview (Hulagabali & Suber, 2019). For example, “most OA journals charge APCs” and “most OA journals are low in quality”, which are widespread but not true. Our study helps to dispel these misunderstandings by demonstrating that many journals are entirely free and that many exist for academic purposes: just because they are small does not mean they are not of high quality.
In addition to the issues above, small publishers also face other challenges. For example, in terms of longevity of data preservation, small publishers are more likely to lose long-term access (Crawford, 2011, p. 32). On this point, DOAJ published an article in 2020 announcing that they would collaborate with the CLOCKSS Archive, Internet Archive, Keepers Registry/ISSN International Centre and Public Knowledge Project (PKP) to improve the preservation of small OA journals.
Conclusion
From the three observations above, we can conclude that no matter the “mixed” publishers are included or excluded in our research’s scale, the “long-tail” and “the smaller, the NO-APCer” trends are always evident. Small non-profit publishers, with such a large number, need to look for various breakthroughs if they want to survive and grow.
Notes
Crow, 2006, “The market context for society publishers”.
Crow, 2006, “The market context for society publishers”, with reference to the Ulrich’s Periodicals Directory in 2005, http://www.ulrichsweb.com/ulrichsweb/
Crow, 2006, “Abstract”.
Edgar & Willinsky, 2010, p. 1.
Morrison, 2018b, “Abstract”.
As indicated in The OA Diamond Journals Study. Part 1: Findings. Jeroen Bosman, Jan Erik Frantsvåg, Bianca Kramer, Pierre-Carl Langlais, Vanessa Proudman. (2021, March 9). http://doi.org/10.5281/zenodo.4558704. p. 8. “OA diamond journals” are “journals that publish without charging authors and readers, in contrast to APC Gold OA or subscription journals”.
References
Bosman, J., Frantsvåg, J., Kramer, B., Langlais, P.-C., & Proudman, V. (2021). OA Diamond Journals Study. Part 1: Findings. Zenodo. http://doi.org/10.5281/zenodo.4558704
Crawford, W. (2011). Open access: what you need to know now. American Library Association.