by Heather Morrison
Abstract
Pricing trends for 2018 – 2019 were compared on a per-journal and per-publisher basis. In contrast to the relatively unchanging global average APC, per-journal and per-publisher shows a mixture of trends. Most journals did not change in price from 2018 to 2019; 13% increased in price, 25% decreased. Journals included in DOAJ showed a greater tendency to increase in price (37%). Average price changes per publisher ranged from 0 (no change) to a 34% average increase in price. In some cases, price increases and decreases cancel each other out resulting in an average of 0 (no change) masking considerable change at the per-journal level. Only 2 publishers have APPCs; these have similar average prices. Average APC price by publisher ranges from 246 to 2,851 USD. UK-based not-for-profit publisher Ubiquity Press stands out as having the second-lowest average APC of 536 USD with no price increases.
Context
As reported by Singh & Morrison (2019), the global average APC has shown little change between 2010 and 2019, but variation in the mode and a constant increase in maximum APC and APPC, along with case studies by the SKC team, suggests that this does not give the whole picture of what is happening. The purpose of this study is to investigate whether change in APC or APPC is more obvious at the per-journal or per-publisher level.
Research question
Are there observable changes in APC or APPC at the per-journal or per-publisher level from 2018 – 2019?
Method
The data for this study is from the 2019 iteration of the APC longitudinal study; for documentation of the main study, a link to the dataset, and an invitation to open peer review, see Morrison et al. (2019). As reported by Singh & Morrison (2019), the majority of journals do not charge publication fees. Journals from the main spreadsheet were selected for which an APC or APPC amount is available for both 2018 and 2019. This resulted in a sample of 2,471 journals. Currencies were matched and original currency used for calculations wherever the same currency was listed in both years (2,255 APC journals). The reason for matching currency is to avoid conflation of currency fluctuations and pricing changes. For the remaining journals, APC in USD equivalent was done, using June 30, 2019 XE Currency Converter rates. The 2018 price was deducted from the 2019 price and the difference was divided into the 2018 price to determine the percentage of change.
A second sub-selection was drawn from this sample, limiting to journals that were listed in DOAJ on January 31, 2019, resulting in a sample of 1,514 journals. Of these, 1,394 match in currency in 2018 and 2019. Calculation of the numeric and percentage difference in price from 2018 to 2019 was calculated as described above. This eliminates journals by publishers that are no longer listed in DOAJ, newer journals that are not yet listed in DOAJ and other journals that are listed due to not meeting one of the DOAJ criteria, such as minimum number of articles published per year.
Per-publisher analysis was conducted using the second (DOAJ journals only) sample. For each publisher with more than one journal in the sample, the average APC or APPC was calculated as well as the average, minimum and maximum percentage change.
Results
Journals with APC or APPC data in both 2018 and 2019
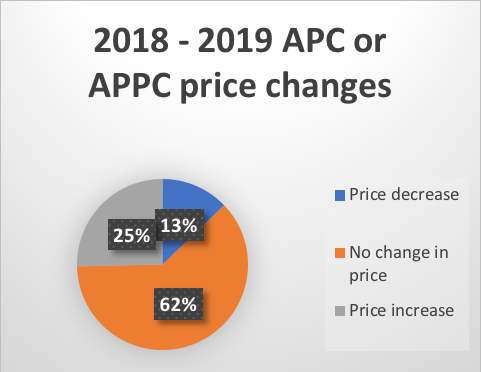
As illustrated in the table and chart below, pricing trends on a per-journal basis varied. The majority of journals (62%) did not change in price; 13% decreased in price and 25% increased in price.
| 2018 – 2019 APC or APPC price changes | ||
| # journals | % journals | |
| Price decrease | 317 | 13% |
| No change in price | 1,528 | 62% |
| Price increase | 626 | 25% |
| Grand Total | 2,471 | |
Journals in DOAJ 2019 with APC or APPC data in both 2018 and 2019
The following table and chart illustrate a somewhat different trend when limiting to journals included in DOAJ. The percentage of journals with price decreases is the same at 13%, but the percentage of journals with price increases in higher at 37%. Half the journals (50%) did not change in price.
| 2018 – 2019 APC or APPC price changes, DOAJ journals only | ||
| # journals | % journals | |
| Price decrease | 191 | 13% |
| No change | 758 | 50% |
| Price increase | 565 | 37% |
| Grand Total | 1,514 | |

Price change 2018 – 2019 by publisher
The following illustrates that pricing changes from 2018 – 2019 varied by publisher. 6 publishers had no price changes from 2018 – 2019. 16 publishers did have price changes from 2018 – 2019. For the publishers with price changes, there were differences in the pattern of change. Nature and Sage’s price increases and price decreases cancel each other out for an average of no change in price. A few publishers either kept prices the same or increased them, however most publishers have a mixture of price increases and decreases. In interpreting the pricing trends, it is important to consider the average price. A publisher with no price increases may have a higher average APC than a publisher with price increases. The average prices will be highlighting in the next table.
| Publisher | Average APC 2019 * | Currency | APC or APPC in USD **** | Average price change % 2018 – 2019 | Min. price change 2018 – 2019 *** | Max. price change 2018 – 2019 |
| Publishers with no price changes 2018 – 2019 | ||||||
| APC | Average APC 2019 * | |||||
| American Geophysical Union (AGU) | 1,800 | USD | 1,800 | 0% | ||
| De Gruyter | 1,045 | EUR | 1,188 | 0% | ||
| Karger Publishers | 2,783 | CHF | 2,851 | 0% | ||
| Public Library of Science (PLoS) | 2,428 | USD | 2,428 | 0% | ||
| Ubiquity Press** | 536 | USD | 536 | 0% | ||
| APPC (per-age not per-article) | Average APPC 2019 * | |||||
| Copernicus Publications (APPC) per-page not per-article | 64 | EUR | 73 | 0% | ||
| Publishers with price changes 2018 – 2019 | ||||||
| APC | Average APC 2019 * | |||||
| BioMed Central | 1,533 | GBP | 1,947 | 10% | -42% | 123% |
| Dove Medical Press | 1,983 | USD | 1,983 | 1% | 0% | 18% |
| Elsevier ** | 1,633 | USD | 1,633 | 13% | -50% | 567% |
| Frontiers Media S.A. | 2,297 | USD | 2,297 | 10% | 0% | 100% |
| Hindawi Limited | 1,161 | USD | 1,161 | 6% | -24% | 95% |
| MDPI AG | 848 | CHF | 869 | 23% | 0% | 227% |
| Nature Publishing Group | 2,031 | GBP | 2,579 | 0% | -21% | 28% |
| Oxford University Press ** | 1,572 | USD | 1,572 | 22% | -51% | 61% |
| PAGEPress Publications | 473 | EUR | 538 | 1% | 0% | 20% |
| SAGE Publishing ** | 1,429 | USD | 1,429 | 0% | -59% | 67% |
| SpringerOpen | 1,205 | EUR | 1,370 | 8% | -37% | 109% |
| Taylor & Francis Group ** | 693 | USD | 693 | 6% | -56% | 500% |
| Wiley | 2,331 | USD | 2,331 | 3% | -27% | 100% |
| Wolters Kluwer | 2,433 | USD | 2,433 | 1% | 0% | 6% |
| Wolters Kluwer Medknow Publications ** | 246 | USD | 246 | 34% | -57% | 602% |
| APPC (per-page not per-article) | ||||||
| AOSIS (APPC) per-page not per-article | 1,196 | ZAR | 85 | 5% | 0% | 19% |
| * Average prices of journals listed in DOAJ in Jan 2019 and for which APC data is available for both 2018 and 2019. | ||||||
| ** Prices converted to USD June 30, 2019 as APCs listed in different currencies. | ||||||
| *** Negative numbers reflect price decreases | ||||||
| **** Based on June 30, 2019 currency conversion rate, XE currency | ||||||
The following table shows the average APC in USD by publisher in ascending order (starting with the lowest price), along with average, minimum and maximum price changes from 2018 – 2019 by percentage.
| Publisher | 2019 Average APC or APPC in USD | Average price change 2018 – 2019 % | Min. price change 2018 – 2019 *** | Max. price change 2018 – 2019 |
| APC | ||||
| Wolters Kluwer Medknow Publications ** | 246 | 34% | -57% | 602% |
| Ubiquity Press** | 536 | 0% | ||
| PAGEPress Publications | 538 | 1% | 0% | 20% |
| Taylor & Francis Group ** | 693 | 6% | -56% | 500% |
| MDPI AG | 869 | 23% | 0% | 227% |
| Hindawi Limited | 1,161 | 6% | -24% | 95% |
| De Gruyter | 1,188 | 0% | ||
| SpringerOpen | 1,370 | 8% | -37% | 109% |
| SAGE Publishing ** | 1,429 | 0% | -59% | 67% |
| Oxford University Press ** | 1,572 | 22% | -51% | 61% |
| Elsevier ** | 1,633 | 13% | -50% | 567% |
| American Geophysical Union (AGU) | 1,800 | 0% | ||
| BioMed Central | 1,947 | 10% | -42% | 123% |
| Dove Medical Press | 1,983 | 1% | 0% | 18% |
| Frontiers Media S.A. | 2,297 | 10% | 0% | 100% |
| Wiley | 2,331 | 3% | -27% | 100% |
| Public Library of Science (PLoS) | 2,428 | 0% | ||
| Wolters Kluwer | 2,433 | 1% | 0% | 6% |
| Nature Publishing Group | 2,579 | 0% | -21% | 28% |
| Karger Publishers | 2,851 | 0% | ||
| APPC (per-age not per-article) | ||||
| Copernicus Publications (APPC) per-page not per-article | 73 | 0% | ||
| AOSIS (APPC) per-page not per-article | 85 | 5% | 0% | 19% |
Discussion and conclusions
The data clearly demonstrate that the volume and direction of pricing changes varies by journal and by publisher. From 2018 to 2019, most journals did not change in price, some decreased in price, and others increased in price. Different APC based publishers display different tendencies and a wide range of average APCs, from 246 to 2,851 USD. The two APPC based publishers had similar pricing. The lowest average APC of 246 USD was for Wolters Kluwer Medknow. As noted by Avashti & Morrison (2019), most Medknow journals do not charge APCs; the average APC is likely impacted by the area served, as Medknow originated in India. It is not surprising that the 3 highest average APCs are associated with European based publishers (Wolters Kluwer, Nature, and Karger). However, the low average APC of UK based Ubiquity Publishing at 536 USD, combined with no price increases, is in marked contrast with Oxford University Press’ average APC of 1,572 USD and average price increase of 22%. This evidence of differences in APC / APPC and pricing trends by publisher supports, and is supported by, Shi & Morrison’s (2019) comparison of 4 pairs of publishers and sub-publishers.
References
Avasthi, N & Morrison, H (2019). Medknow 2019 – is this the best for India? Sustaining the Knowledge commons. https://sustainingknowledgecommons.org/2019/11/23/medknow-2019-is-this-the-best-for-india/
Morrison, H. et al. (2019). OA Main 2019: Dataset, documentation and open peer review invitation. Sustaining the knowledge commons. https://sustainingknowledgecommons.org/2019/11/20/oa-main-2019-dataset-documentation-and-open-peer-review-invitation/
Shi, A & Morrison, H. (2019). APCs comparisons among different publishers in 2019. Sustaining the knowledge Commons. https://sustainingknowledgecommons.org/2019/11/26/apcs-comparisons-among-different-publishers-in-2019/
Singh, S. & Morrison, H. (2019). OA journals non-charging and charging central trends 2010 – 2019. Sustaining the knowledge commons. https://sustainingknowledgecommons.org/2019/11/23/oa-journals-non-charging-and-charging-central-trends-2010-2019/
Cite as: Morrison, H. (2019). APC price changes 2019 – 2018 by journal and by publisher. Sustaining the knowledge commons. https://sustainingknowledgecommons.org/2019/11/26/apc-price-changes-2019-2018-by-journal-and-by-publisher/
