by César Villamizar and Heather Morrison
In May 2015 we conducted a pilot study correlating OA APCs and the journal impact factor, using data from 2010, 2013 and 2014. Here are some early results:
- about 10% of the journals listed in JCR are DOAJ journals
- over 10% of the journals listed in DOAJ have an impact factor
- about 40% of the DOAJ IF journals had an APC as of May 2015 (estimate; higher than overall journals with APC)
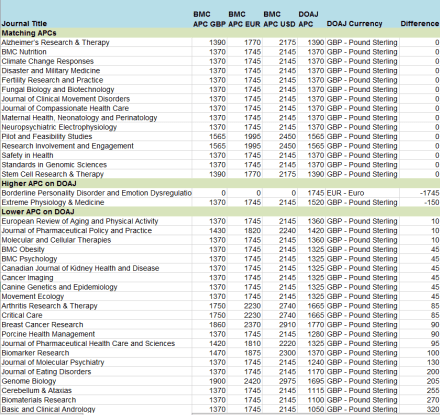
- average APC of IF journals in 2014 more than double overall average APC ($1,948 as compared with overall average of $964)
- average APCs of IF journals increased by 7% in a 5-month period from 2013 to 2014 and by 16% from 2010 to 2014
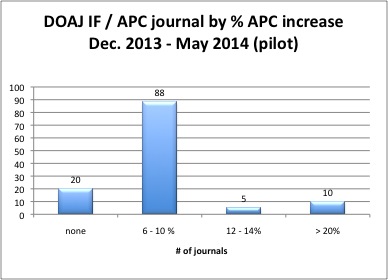
- over 80% of APC / IF journals increased price by 6% or more in a 5-month period from December 2013 to May 2014
- about 20% of APC / IF journals increased price by 10% or more in a 5-month period from December 2013 to May 2014
- 7% of APC / IF journals increased price by 20% or more in a 5-month period from December 2013 to May 2014
Conclusion: about 10% of DOAJ journals have impact factors, and about 10% of impact factor journals are DOAJ journals. Open access journals (or some OA journals) using the APC business model may be exploiting impact factor status as a means to raise prices. Further investigation warranted.
Details
As of May 3, 2015, Thomson Reuters’ Journal Citation Reports (JCR) listed 11,619 journals with impact factor (IF). Of these, 1,146 are listed in the Directory of Open Access Journals (DOAJ). As of May 15, 2015, 10,532 journals were listed in DOAJ. This means that 9.8% of the titles listed in JCR are DOAJ titles, and 10.8% of DOAJ journals have an IF.
The pilot involved selecting half of the DOAJ journals with an IF (572 journals from both sciences and social sciences, selected alphabetically abbreviated title A – J Otolaryngol-Head and looking up the quartile and subject ranking. Of these titles, 169 were included in the May 2014 OA APC sample. For 126 journals data was available for both December 2013 and May 2014, the basis of the 2013-2014 calculations. Assuming that the portion of APC-charging journals would be the same for non-sampled journals, this would result in an estimate of 229 journals with IF and APC, 40% of the total. This is higher than the 26% of journals with APCs as of May 2014.
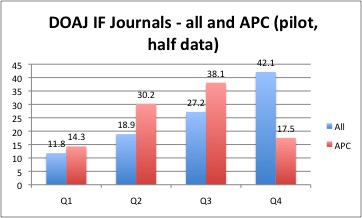
Stats of the 572 in DOAJ with impact factor (pilot):
- 42.1% of the journals are in the quartile four (Q4), 27.2% of the journals are in the quartile three (Q4), 18.9% of the journals are in the quartile two (Q2), and 11.8% of the journals are in the quartile one (Q1)
- 69% of the journals are in the Q4 and Q3
- 31% of the journals are in the Q2 and Q1

- Out of the 572 journals,
- APC data by year
- 2010 B&S : 176
- Dec 2013 SKC : 129
- May 2014 SKC : 169
- We have 126 journals with APC information collected in Dec 2013 SKC and May 2014 SKC
- We have 110 journals with APC information collected in 2010 S&B,Dec 2013 SKC and May 2014 SKC.
Stats of the 126 journals with APC Data (Dec 2013 SKC – May 2014 SKC)
- 17,5% of the journals are in the quartile four (Q4), 38,1% of the journals are in the quartile three (Q4), 30,2% of the journals are in the quartile two (Q2), and 14,3% of the journals are in the quartile one (Q1)
- 55,5% of the journals are in the Q4 and Q3
- 45,5% of the journals are in the Q2 and Q1

- 3,2% of the journals decreased their APC (this is 3 journals; 2 are Hindawi journals. Hindawi as of May 2014 had a practice of rotating free publication. These 2 journals had APCs of 0 in 2014, but have substantial prices today (Bioinorganic Chemistry Applications is now $1,250 and International Journal of Genomics is now $1,500). The third journal with an apparent small price decrease, Experimental Animals, from $200 to $198 USD is likely an anomaly due to a weakening of the main currency, the Japanese Yen, with respect to the USD. In other words, all price decreases appear to be temporary anomalies.
- 14,3% of the journals maintained their APC
- 82,5% of the journals increased their APC at least 6.4%
- 3,1% increased their APC between 6,4% and 7,49%
- 54,8% increased their APC between 7,5% and 9,49%
- 15% increased their APC between 9,5% and 13,9%
- 7% increased their APC between 14% and 25%
The following figure reflects the 123 titles remaining after removing the 2 anomalous 0 APC titles.

The following chart illustrates the percentage of journals by price increase from 2013 to 2014.

|
APC 2010 USD |
APC 2013 USD |
APC 2014 USD |
| Max |
2,165 |
2,420 |
2,650 |
| Min |
500 |
– |
– |
| Min greater than zero |
500 |
200 |
198 |
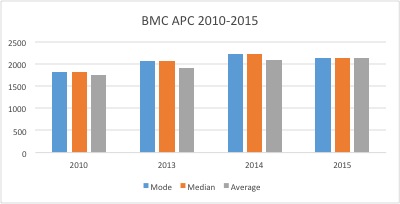
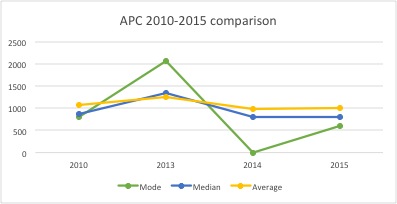
| Median |
1,825 |
2,060 |
2,215 |
| Mode |
1,825 |
2,060 |
2,215 |
| Average |
1,637 |
1,808 |
1,948 |
- Medicine and Biology and Life Science represents 81,1% of the journals categories susceptible to charge APCs
- 3% of the journals in these two categories increased their APC at least in 6.4%
- 9% increased their APC between 6.4% and 7.49%
- 1% increased their APC between 7.5% and 9.49%
- 50% increased their APC between 9.5% and 13.9%
- 8% increased their APC between 14% and 25%
Note and references
2010 data courtesy of Solomon, D.J. & Björk, B.C. (2012). A study of open access journals using article processing charges. The Journal of the American Society for Information Science and Technology 2012. Retrieved May 31, 2015 from http://www.openaccesspublishing.org/apc2/ (data unpublished)
2014 data: Morrison H, Salhab J, Calvé-Genest A, Horava T. Open Access Article Processing Charges: DOAJ Survey May 2014. Publications. 2015; 3(1):1-16. http://www.mdpi.com/2304-6775/3/1/1
Cite as:
Villamizar, C., & Morrison, H. (2015). DOAJ, Impact Factor and APCs. Sustaining the Knowledge Commons / Soutenir Les Savoirs Communs. Retrieved from https://sustainingknowledgecommons.org/2015/06/01/doaj-impact-factor-and-apcs/